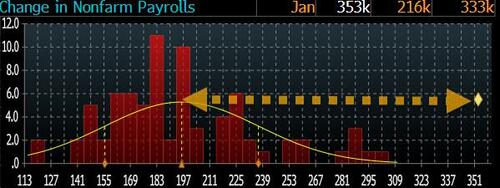
On the surface, it was an blockbuster jobs report, certainly one which nobody expected. Starting at the top, the BLS reported that in January the US unexpectedly added 353K "jobs" - the most since January 2023 (when the print was 482K compared to 131K) , double the consensus forecast of 185K and more than the highest Wall Street estimate (300K from Natixis). In fact, this was a 4-sigma beat to estimate, unheard of in the past year.
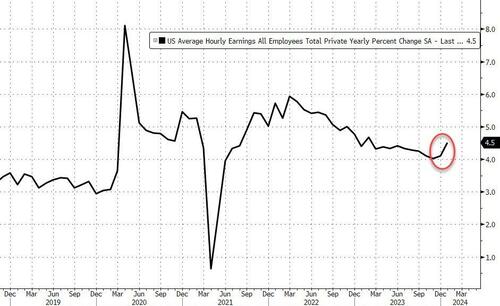
The headline data was stellar across the board, starting with the unemployment rate which once again failed to rise - denying expectations from "Sahm's Rule" that a recession may have already started - all the way to average hourly earnings, which unexpectedly spiked from 4.1% (pre-revision) to 4.5%, the highest since last September, and a slap in the face to the Fed's disinflation narrative...
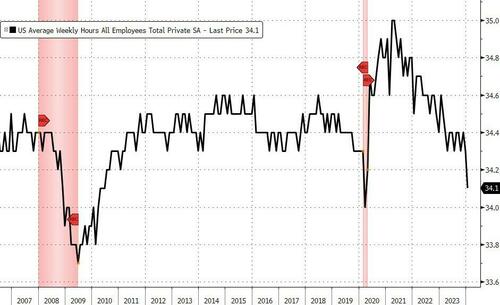
... or it would be if one didn't think of checking how the average rose: well, it turns out that, since average hourly earnings is a fraction, it did not rise due to a jump in actual wages but - since it is earnings over a period of time - "rose" because the BLS decided to sharply slash the number of estimated hours that everyone was working, from 34.3 to just 34.1, which may not sound like a lot until one realizes that the last time the workweek was this low was when the economy was shut down during covid. Excluding the covid lockdowns, one would have to go back to 2010 to find a workweek that was this anemic.
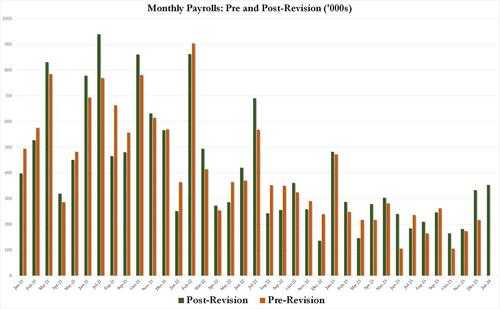
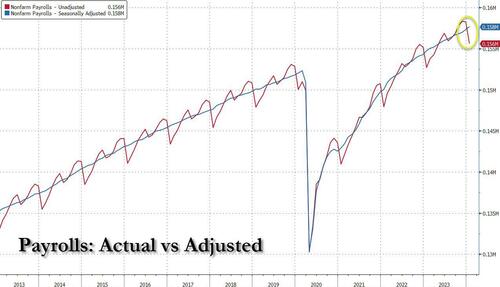
And speaking of revisions, we had a lot of those: in January, the BLS conducted its annual "annual re-benchmarking and update of seasonal adjustment factors." Long story short, what was until December a decline in jobs has now been miraculously transformed into gains, as shown in the chart below.
For those asking, the revisions were unambiguously designed to give the impression that the labor market is slowing much less than it is. Consider this: before the revision, the average monthly job gain in 2021 was largely unchanged (606K pre-revision vs 604K post), and while the average monthly gain in 2022 was revised lower (from 399K to 377K), this was purposefully goalseeked to make 2023 appear stronger, and indeed the average monthly increase in 2023 has been revised from 225K to 255K.
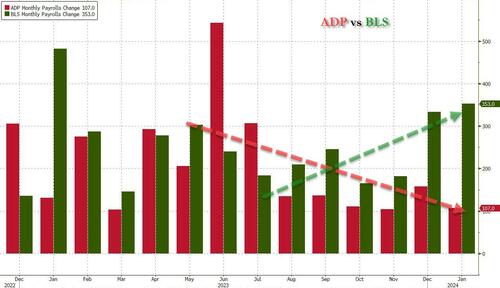
Which would be great, if only it wasn't almost entirely due to the BLS's latest choice of seasonal adjustments, which have gone from merely laughable to full clownshow, as the following comparison between the revised BLS Payrolls number and the ADP payrolls show: the trend is clear: the Biden admin numbers are now clearly rising even as the impartial ADP (which directly logs employment numbers at the company level and is actually far more accurate), shows an accelerating slowdown.
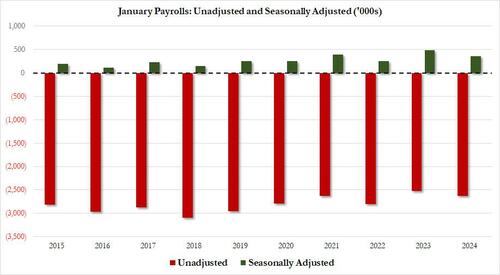
And speaking of seasonal adjustments, the January print was all seasonals, because while the seasonally adjusted payrolls was up 353K, the unadjusted was down 2.635 million, a 3 million jobs delta.
In other words, just a 10% error rate in the seasonal adjustment (roughly where it falls) would wipe out the entire gain and make January increase a decline. Then again, this is the case with every January jobs report, because as shown below, the actual change in jobs in the first month of the year is down anywhere between 2.5 million and 3 million!
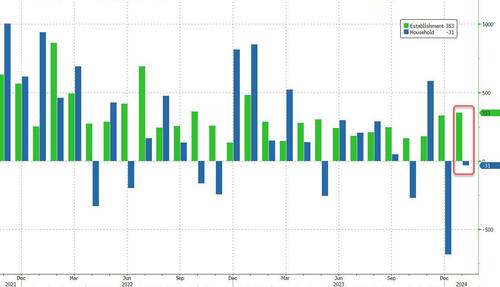
But it's more than just the Biden admin hanging its "success" on seasonal adjustments: when one digs deeper inside the jobs report, all sorts of ugly things emerge... such as the latest divergence between the Establishment (payrolls) and much more accurate Household (actual employment) survey. To wit, while in January the BLS claims 353K payrolls were added, the Household survey found that the number of actually employed workers dropped again, this time by 31K (from 161.183K to 161.152K).
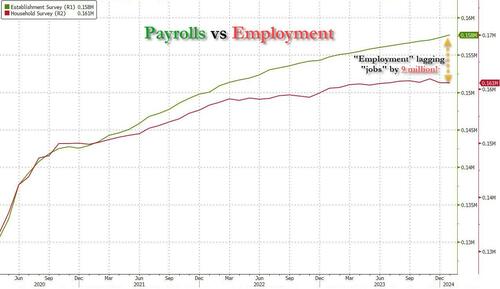
This means that while the Payrolls series hits new all time highs every month since December 2020 (when according to the BLS the US had its last month of payrolls losses), the level of Employment has barely budged in the past year. Worse, as shown in the chart below, such a gaping divergence has opened between the two series in the past 4 years, that the number of Employed workers would need to soar by 9 million (!) to catch up to what Payrolls claims is the employment situation.
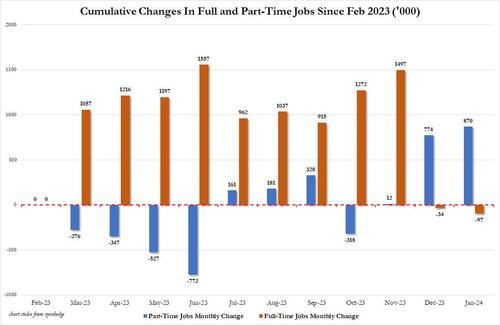
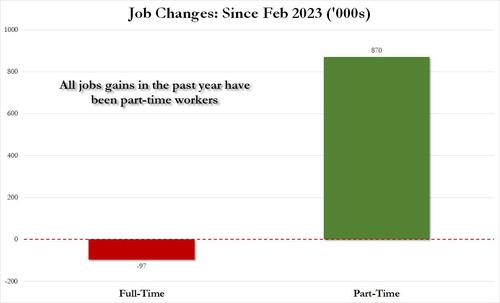
There's more: shifting from a quantitative to a qualitative assessment, reveals just how ugly the composition of "new jobs" has been. Consider this: the BLS reports that in January 2024, the US had 133.1 million full-time jobs and 27.9 million part-time jobs. Well, that's great... until you look back one year and find that in February 2023 the US had 133.2 million full-time jobs, or more than it does one year later! And yes, all the job growth since then has been in part-time jobs, which have increased by 870K since February 2023 (from 27.020 million to 27.890 million).
Here is a summary of the labor composition in the past year: all the jobs have been part-time jobs!
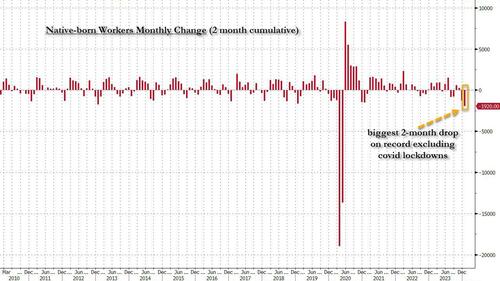
But wait there's even more, because just as we enter the peak of election season and political talking points will be thrown around left and right, especially in the context of the immigration crisis created intentionally by the Biden administration which is hoping to import millions of new Democratic voters (maybe the US can hold the presidential election in Honduras or Guatemala, after all it is their citizens that will be illegally casting the key votes in November), what we find is that in January, the number of native-born worker tumbled again, sliding by a massive 560K to just 129.807 million. Add to this the December data, and we get a near-record 1.9 million plunge in native-born workers in just the past 2 months!
Said otherwise, not only has all job creation in the past 4 years has been exclusively for foreign-born workers, but there has been zero job-creation for native born workers since July 2018!
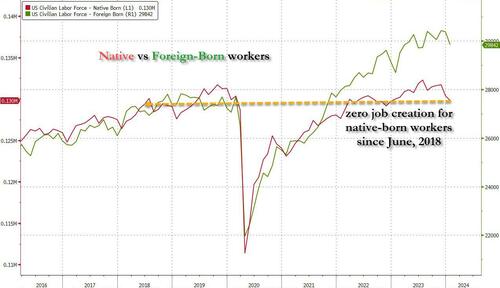
This is a huge issue - especially at a time of an illegal alien flood at the border - and is about to become a huge political scandal, because once the inevitable recession finally hits, there will be millions of furious unemployed Americans demanding a more accurate explanation for what happened - i.e., the illegal immigration floodgates that were opened by the Biden admin.
Which is also why the Biden admin will do everything in his power to insure there is no official recession before November... and is why after the election is over, all economic hell will finally break loose. Until then, however, expect the jobs numbers to get more and more ridiculous.
On the surface, it was an blockbuster jobs report, certainly one which nobody expected. Starting at the top, the BLS reported that in January the US unexpectedly added 353K “jobs” – the most since January 2023 (when the print was 482K compared to 131K) , double the consensus forecast of 185K and more than the highest Wall Street estimate (300K from Natixis). In fact, this was a 4-sigma beat to estimate, unheard of in the past year.
The headline data was stellar across the board, starting with the unemployment rate which once again failed to rise – denying expectations from “Sahm’s Rule” that a recession may have already started – all the way to average hourly earnings, which unexpectedly spiked from 4.1% (pre-revision) to 4.5%, the highest since last September, and a slap in the face to the Fed’s disinflation narrative…
… or it would be if one didn’t think of checking how the average rose: well, it turns out that, since average hourly earnings is a fraction, it did not rise due to a jump in actual wages but – since it is earnings over a period of time – “rose” because the BLS decided to sharply slash the number of estimated hours that everyone was working, from 34.3 to just 34.1, which may not sound like a lot until one realizes that the last time the workweek was this low was when the economy was shut down during covid. Excluding the covid lockdowns, one would have to go back to 2010 to find a workweek that was this anemic.
And speaking of revisions, we had a lot of those: in January, the BLS conducted its annual “annual re-benchmarking and update of seasonal adjustment factors.” Long story short, what was until December a decline in jobs has now been miraculously transformed into gains, as shown in the chart below.
For those asking, the revisions were unambiguously designed to give the impression that the labor market is slowing much less than it is. Consider this: before the revision, the average monthly job gain in 2021 was largely unchanged (606K pre-revision vs 604K post), and while the average monthly gain in 2022 was revised lower (from 399K to 377K), this was purposefully goalseeked to make 2023 appear stronger, and indeed the average monthly increase in 2023 has been revised from 225K to 255K.
Which would be great, if only it wasn’t almost entirely due to the BLS’s latest choice of seasonal adjustments, which have gone from merely laughable to full clownshow, as the following comparison between the revised BLS Payrolls number and the ADP payrolls show: the trend is clear: the Biden admin numbers are now clearly rising even as the impartial ADP (which directly logs employment numbers at the company level and is actually far more accurate), shows an accelerating slowdown.
And speaking of seasonal adjustments, the January print was all seasonals, because while the seasonally adjusted payrolls was up 353K, the unadjusted was down 2.635 million, a 3 million jobs delta.
In other words, just a 10% error rate in the seasonal adjustment (roughly where it falls) would wipe out the entire gain and make January increase a decline. Then again, this is the case with every January jobs report, because as shown below, the actual change in jobs in the first month of the year is down anywhere between 2.5 million and 3 million!
But it’s more than just the Biden admin hanging its “success” on seasonal adjustments: when one digs deeper inside the jobs report, all sorts of ugly things emerge… such as the latest divergence between the Establishment (payrolls) and much more accurate Household (actual employment) survey. To wit, while in January the BLS claims 353K payrolls were added, the Household survey found that the number of actually employed workers dropped again, this time by 31K (from 161.183K to 161.152K).
This means that while the Payrolls series hits new all time highs every month since December 2020 (when according to the BLS the US had its last month of payrolls losses), the level of Employment has barely budged in the past year. Worse, as shown in the chart below, such a gaping divergence has opened between the two series in the past 4 years, that the number of Employed workers would need to soar by 9 million (!) to catch up to what Payrolls claims is the employment situation.
There’s more: shifting from a quantitative to a qualitative assessment, reveals just how ugly the composition of “new jobs” has been. Consider this: the BLS reports that in January 2024, the US had 133.1 million full-time jobs and 27.9 million part-time jobs. Well, that’s great… until you look back one year and find that in February 2023 the US had 133.2 million full-time jobs, or more than it does one year later! And yes, all the job growth since then has been in part-time jobs, which have increased by 870K since February 2023 (from 27.020 million to 27.890 million).
Here is a summary of the labor composition in the past year: all the jobs have been part-time jobs!
But wait there’s even more, because just as we enter the peak of election season and political talking points will be thrown around left and right, especially in the context of the immigration crisis created intentionally by the Biden administration which is hoping to import millions of new Democratic voters (maybe the US can hold the presidential election in Honduras or Guatemala, after all it is their citizens that will be illegally casting the key votes in November), what we find is that in January, the number of native-born worker tumbled again, sliding by a massive 560K to just 129.807 million. Add to this the December data, and we get a near-record 1.9 million plunge in native-born workers in just the past 2 months!
Said otherwise, not only has all job creation in the past 4 years has been exclusively for foreign-born workers, but there has been zero job-creation for native born workers since July 2018!

This is a huge issue – especially at a time of an illegal alien flood at the border – and is about to become a huge political scandal, because once the inevitable recession finally hits, there will be millions of furious unemployed Americans demanding a more accurate explanation for what happened – i.e., the illegal immigration floodgates that were opened by the Biden admin.
Which is also why the Biden admin will do everything in his power to insure there is no official recession before November… and is why after the election is over, all economic hell will finally break loose. Until then, however, expect the jobs numbers to get more and more ridiculous.
Loading…
