Something odd is taking place in the oil market. While on one hand "data" dissembled by Biden's Dept of Energy and specifically its statistical arm, the Energy Information Administration, has done everything it could to indicate there is a glut of oil, which is understandable - there is nothing Biden's handlers fear more than an inflationary surge in oil and gasoline prices ahead of the November elections and will do everything in their power to mandate a dataset that has the most adverse impact on oil prices, the physical market is sending just the opposite signal, with spreads showing screaming physical tightness.
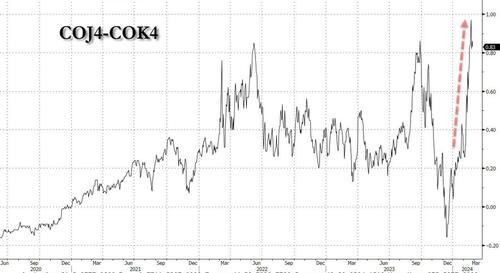
Consider the Brent prompt spread which after tumbling to a multi-year low in late December, has exploded higher to a backwardation around 90 cents...
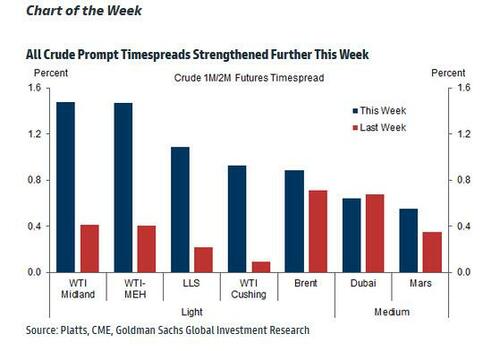
... entrenching its strongest position since late October, while several other timespreads also the firmest since last September. The comparable WTI April-May spread was trading around 50 cents after hitting 75 cents last week.
Commenting on the surge in time-spreads, Citi strategist Max Leyton - who is far less bearish than oil permabear Ed Morse who recently left the bank - says they strengthened on the “perfect storm” of Atlantic Basin supply issues, and notes that supply issues include “ongoing Red Sea vessel diversions, US freeze-offs hitting oil output, worker protests disrupting Libyan supply, UK oil terminal logistics limiting North Sea Forties supply, and buying up of crude cargoes at the Nigerian Dangote refinery."
“Most of these issues could ease,” and the second quarter “still looks like a surplus quarter for total oil balances, meaning current strength could pause.” Of course, the current strength could very well accelerate if there is even one small geopolitical hiccup in the middle east where nobody expects any surprises, and where all eyes remain on how much more of its bitch Iran can make Biden, before even the US president is forced to retaliate even if it means 4mm barrels taken off the daily market.
The dramatic spikes in prompt timespreads across the crude complex was the Goldman chart of the week just a few days ago, and shows just how dramatically and rapidly the market has tigthened up as a result of sudden scarcity of physical which, however, has barely received any mention in daily discussions about the energy market.
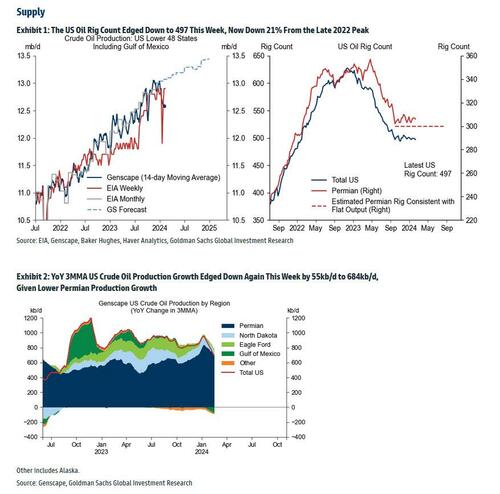
Below we share some more charts from Goldman looking at the most recent indicators in physical markets, starting with supply where Goldman is seeing distinct "firmness"...
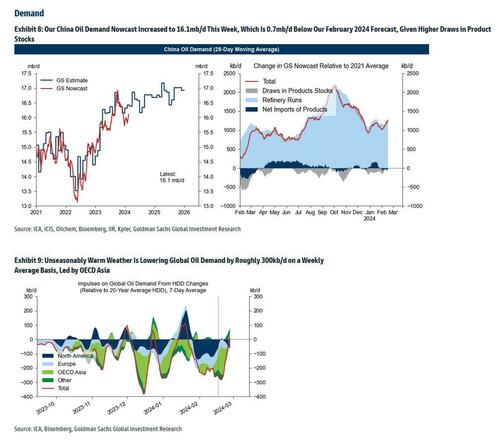
... while on the demand side of the equation, recent unseasonaly warm weather has lowered global oil demand by some 300kb/d.
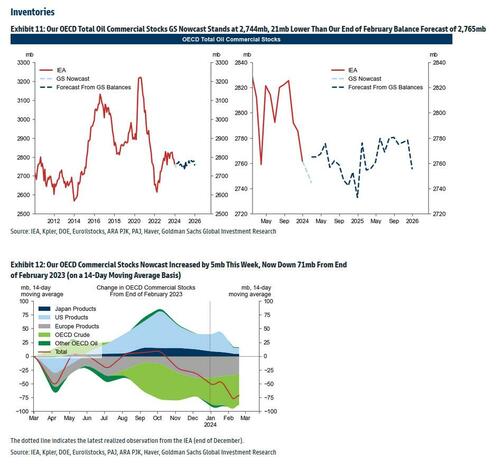
As a result of the tightness in supply, Goldman calculates that total OECD inventories are now about 21mb lower than the company's end of February balance forecast of 2,765 mb, with estimates pointing to further tightness.
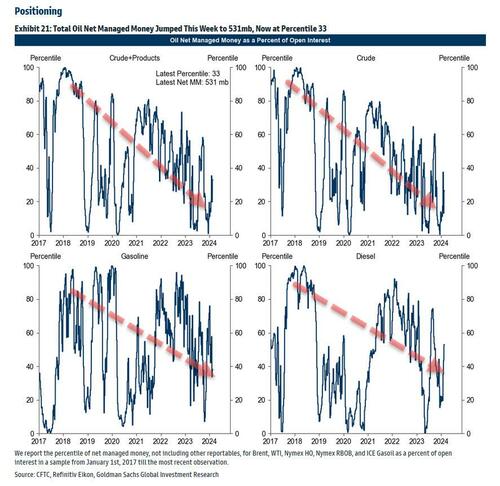
Yet despite this continued decline in supply and inventories, oil prices remain rangebound and seem unable to breakout solidly about the low 80s. Why is that? In a word: financialization, aka "paper oil", because while the physical oil market is screaming higher, financial players (managed money) continue to aggressively sell and short the sector as shown in the chart below.
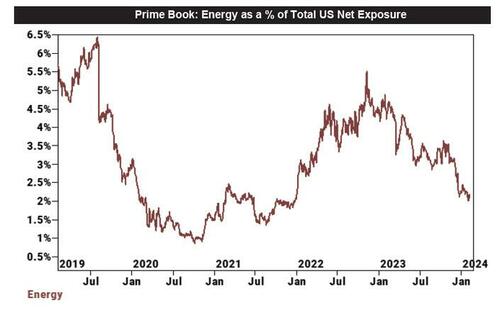
This desperate attempt by financial players to keep their underwater positions from getting stopped out and sparking a cascade of margin calls has also translated into a ravenous shorting of energy stocks which as we pointed out a week ago, are the most shorted sector in Goldman's prime brokerage.
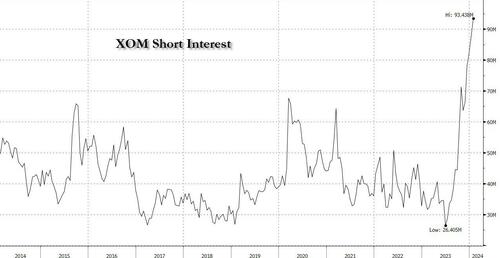
This, in turn, has translated into some of the marquee energy names such as Exxon seeing the highest short interest on record...
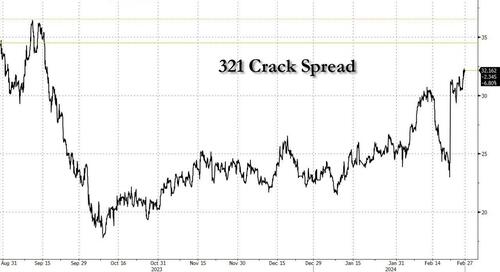
... even though the lifeblood of refiners such as the 3-2-1 Crack Spread is now surging higher.
Which begs the question: how much tighter will physical oil have to get before it finally breaks the financial oil shorts?
The full Goldman note is available to pro subscribers in the usual place.
Something odd is taking place in the oil market. While on one hand “data” dissembled by Biden’s Dept of Energy and specifically its statistical arm, the Energy Information Administration, has done everything it could to indicate there is a glut of oil, which is understandable – there is nothing Biden’s handlers fear more than an inflationary surge in oil and gasoline prices ahead of the November elections and will do everything in their power to mandate a dataset that has the most adverse impact on oil prices, the physical market is sending just the opposite signal, with spreads showing screaming physical tightness.
Consider the Brent prompt spread which after tumbling to a multi-year low in late December, has exploded higher to a backwardation around 90 cents…
… entrenching its strongest position since late October, while several other timespreads also the firmest since last September. The comparable WTI April-May spread was trading around 50 cents after hitting 75 cents last week.
Commenting on the surge in time-spreads, Citi strategist Max Leyton – who is far less bearish than oil permabear Ed Morse who recently left the bank – says they strengthened on the “perfect storm” of Atlantic Basin supply issues, and notes that supply issues include “ongoing Red Sea vessel diversions, US freeze-offs hitting oil output, worker protests disrupting Libyan supply, UK oil terminal logistics limiting North Sea Forties supply, and buying up of crude cargoes at the Nigerian Dangote refinery.”
“Most of these issues could ease,” and the second quarter “still looks like a surplus quarter for total oil balances, meaning current strength could pause.” Of course, the current strength could very well accelerate if there is even one small geopolitical hiccup in the middle east where nobody expects any surprises, and where all eyes remain on how much more of its bitch Iran can make Biden, before even the US president is forced to retaliate even if it means 4mm barrels taken off the daily market.
The dramatic spikes in prompt timespreads across the crude complex was the Goldman chart of the week just a few days ago, and shows just how dramatically and rapidly the market has tigthened up as a result of sudden scarcity of physical which, however, has barely received any mention in daily discussions about the energy market.
Below we share some more charts from Goldman looking at the most recent indicators in physical markets, starting with supply where Goldman is seeing distinct “firmness”…
… while on the demand side of the equation, recent unseasonaly warm weather has lowered global oil demand by some 300kb/d.
As a result of the tightness in supply, Goldman calculates that total OECD inventories are now about 21mb lower than the company’s end of February balance forecast of 2,765 mb, with estimates pointing to further tightness.
Yet despite this continued decline in supply and inventories, oil prices remain rangebound and seem unable to breakout solidly about the low 80s. Why is that? In a word: financialization, aka “paper oil”, because while the physical oil market is screaming higher, financial players (managed money) continue to aggressively sell and short the sector as shown in the chart below.
This desperate attempt by financial players to keep their underwater positions from getting stopped out and sparking a cascade of margin calls has also translated into a ravenous shorting of energy stocks which as we pointed out a week ago, are the most shorted sector in Goldman’s prime brokerage.
This, in turn, has translated into some of the marquee energy names such as Exxon seeing the highest short interest on record…
… even though the lifeblood of refiners such as the 3-2-1 Crack Spread is now surging higher.
Which begs the question: how much tighter will physical oil have to get before it finally breaks the financial oil shorts?
The full Goldman note is available to pro subscribers in the usual place.
Loading…
