Authored by Michael Lebowitz via RealInvestmentAdvice.com,
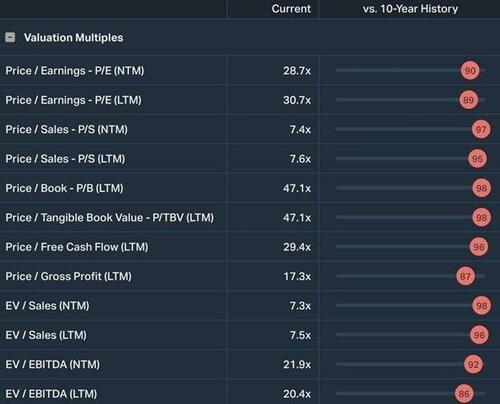
Apple’s valuations are near their most expensive levels of the last ten years. Now consider that today’s valuation premiums are amidst a much higher risk-free bond yield than during most of the previous ten years.
Apple has a market cap of $2.8 trillion. Assuming its price-to-earnings ratio and margins remain stable, Apple must sell nearly $400 billion of products and services each year to keep its share price stable. To fathom that, consider that every man, woman, and child on planet Earth must spend about $45 on Apple products yearly.
The point of sharing those statistics and the valuation premium is to contextualize whether Apple can grow at the growth rate implied by its investors. Further, if its earnings growth alone doesn’t support a valuation premium to the market’s valuation, can the continued use of stock buybacks support the premium?
Apple’s Track Record
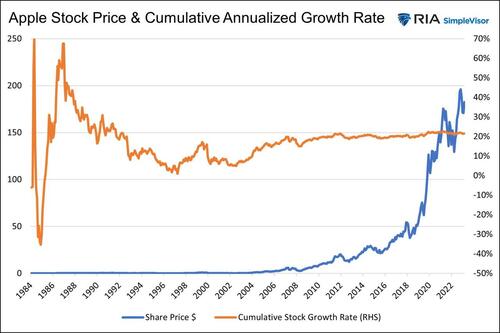
The graph below shows Apple shares have provided its investors with a fantastic 20% annualized growth rate for the last 39 years. That is more than double the 8.7% growth rate for the S&P 500 over the same period.
Its exceptional outperformance versus the market is warranted. Since 1993, Apple’s earnings per share have grown at over 3x the rate of the S&P 500.
Apple’s Recent Trends
While Apple may have an incredible record of earnings growth and share price appreciation, current investors must avoid the temptation to rest on prior trends. Instead, their focus should be on what may lie ahead.
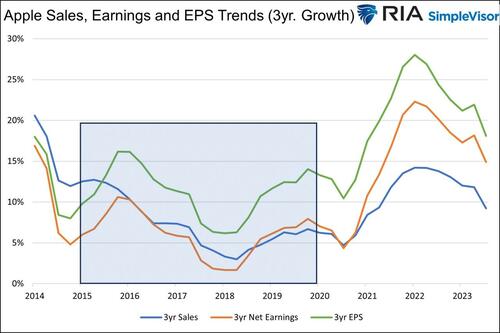
The following graph shows the running 3-year annualized growth rates for sales, net earnings, and earnings per share. Recent growth rates are much lower than they have been. We truncated the graph to the last ten years to better highlight the more recent trends.
Earnings and sales were boosted in 2021 and 2022 by the stimulus-related spending and inflation caused by the massive pandemic-related fiscal stimulus. Many companies, including Apple, saw demand increase and could expand profit margins, as inflation was easy to pass on to customers.
However, Apple’s earnings and sales growth are returning to pre-pandemic levels. To better appreciate what the future may hold, consider the five pre-pandemic years highlighted in blue. During that period, sales grew by 4.2% annually. Net earnings grew by 4.3% and EPS by 10.4%
The Magic of Stock Buybacks
The price of a stock is not meaningful. Apple stock trades for $182 a share. Its market cap is roughly $2.85 trillion. If the company repurchased all but one share, its market cap would be unchanged, but its share price would be $2.85 trillion.
That simple example highlights how valuable buying back shares can be for investors.
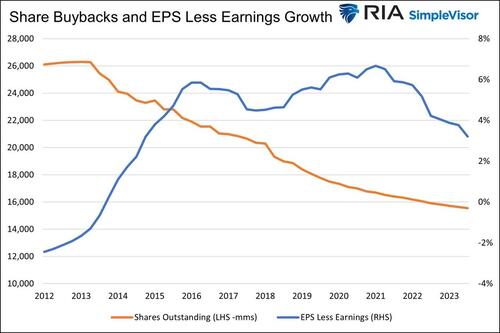
Back to Apple’s recent EPS, net earnings and sales trends. Its EPS grew roughly double that of sales or net earnings. The graph below helps explain how they pulled off such a feat. Once Apple started buying back shares in late 2013, its EPS grew 4-6% more than its actual earnings.
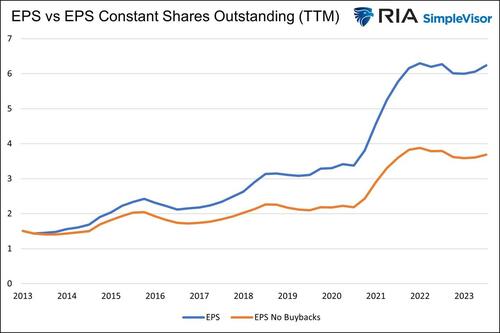
The following graph compares Apple’s annual EPS versus its EPS if it had not repurchased shares. The graph starts in 2013 when Apple began to aggressively buy back shares.
Why The Premium Versus The Market?
Apple has recently grown its earnings and sales at an approximate 5% growth rate. This is only about 1% higher than the approximate 4% nominal GDP growth from 2017 to 2019. But less than the approximate 9% EPS and sales per share growth of the S&P 500.
So why are Apple investors willing to pay a premium for subpar growth?
Apple is an incredibly successful and innovative company with a long history of rewarding investors. Investors are willing to pay for the future potential of new products and services with enormous income potential. Such investor goodwill is hard to put a price on.
Passive investment strategies are a second reason. Apple and Microsoft are the two largest stocks by market cap. The increased popularity of passive investment strategies feeds the most extensive market cap stocks disproportionately to smaller companies.
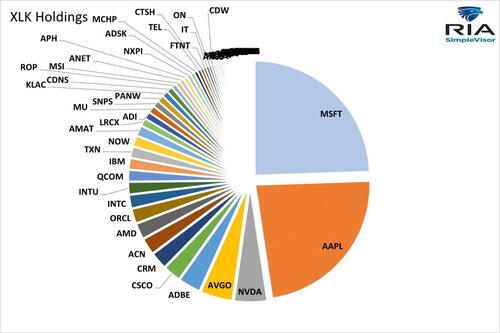
Consider the holdings of XLK, the $52 billion tech sector ETF. Apple and Microsoft make up almost 50% of the ETF. If an investor buys $1,000 of XLK, approximately $500 will go to Apple and Microsoft, and the remaining 62 companies will get the rest.
Finally, and most importantly, are share buybacks. While we can’t quantify what future innovation, goodwill, and passive investment strategies are worth, we can grasp Apple’s ability to continue forward with buybacks.
Future Buyback Funding
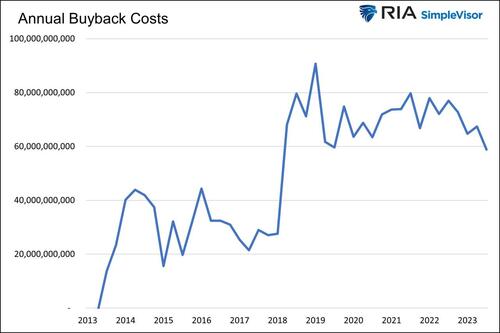
The chart below shows Apple has been spending between $60 and $80 billion per year on stock buybacks. Keep that figure in mind as we walk through its sources of cash to continue buying back shares.
Debt, cash, and earnings are their predominant sources to fund buybacks.
Debt Funded Buybacks
Apple came to market with its first long-term debt offering in 2013, commensurate with its initiation of share buybacks. Apple’s debt peaked eight years later at $109 billion. Using debt to fund share buybacks made sense, with borrowing rates in the very low single digits. However, the calculus has changed, with rates now at 4% and higher.
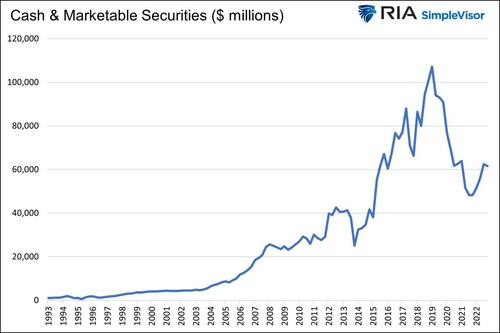
Cash and Marketable Securities on Apple’s balance sheet are at $61.5 billion, about a year’s worth of buyback potential. While a massive amount of money, it is off its peak of $107 billion.
Lastly are earnings. Apple has been earning about $100 billion a year since 2021. Even if they regress to pre-pandemic levels ($50-$60 billion), earnings are enough to continue supporting its buyback program. However, if earnings are employed to buy back shares, it comes at the expense of investments toward innovations and product upgrades. Furthermore, Apple pays about $15 billion yearly in dividends, which also requires funding.
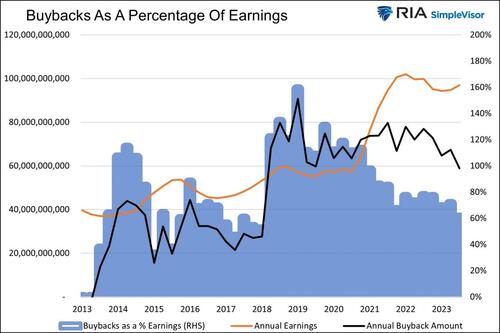
The graph below shows that from 2018 to 2020, Apple spent more on buybacks than it made. It was relying on debt and cash to make up the difference.
Over the last two years, buybacks only account for 60% of earnings, allowing cash to grow for future buybacks and investments. Hence, if $100 billion a year in earnings is sustainable, even without growth, $60 to $80 billion a year in buybacks is entirely possible. If earnings retreat to their pre-pandemic level, debt and cash will be required. If interest rates stay at their current levels, debt may not be financially sensible.
Summary
Unlike most “growth” companies, a bet on Apple is a bet on their ability to buy back shares. It appears that Apple can continue to buy back its shares with earnings and cash. Such would maintain their higher-than-market EPS growth with or without above-market earnings growth.
Other than negative earnings growth and high-interest rates, a buyback tax on corporations, as is being proposed, could also reduce or eliminate their buyback program. If such a bill were to pass or Apple cuts back on buybacks for another reason, its premium valuation may wither away.
Loading…
