Are the United States getting more dangerous or more safe? The answer partially depends on your metric of choice.
For example, by examining homicide rates by state from 2012 to 2022, it can be seen that rates have increased almost across the board. That said, they are still lower than rates seen in the 1980s and 1990s.
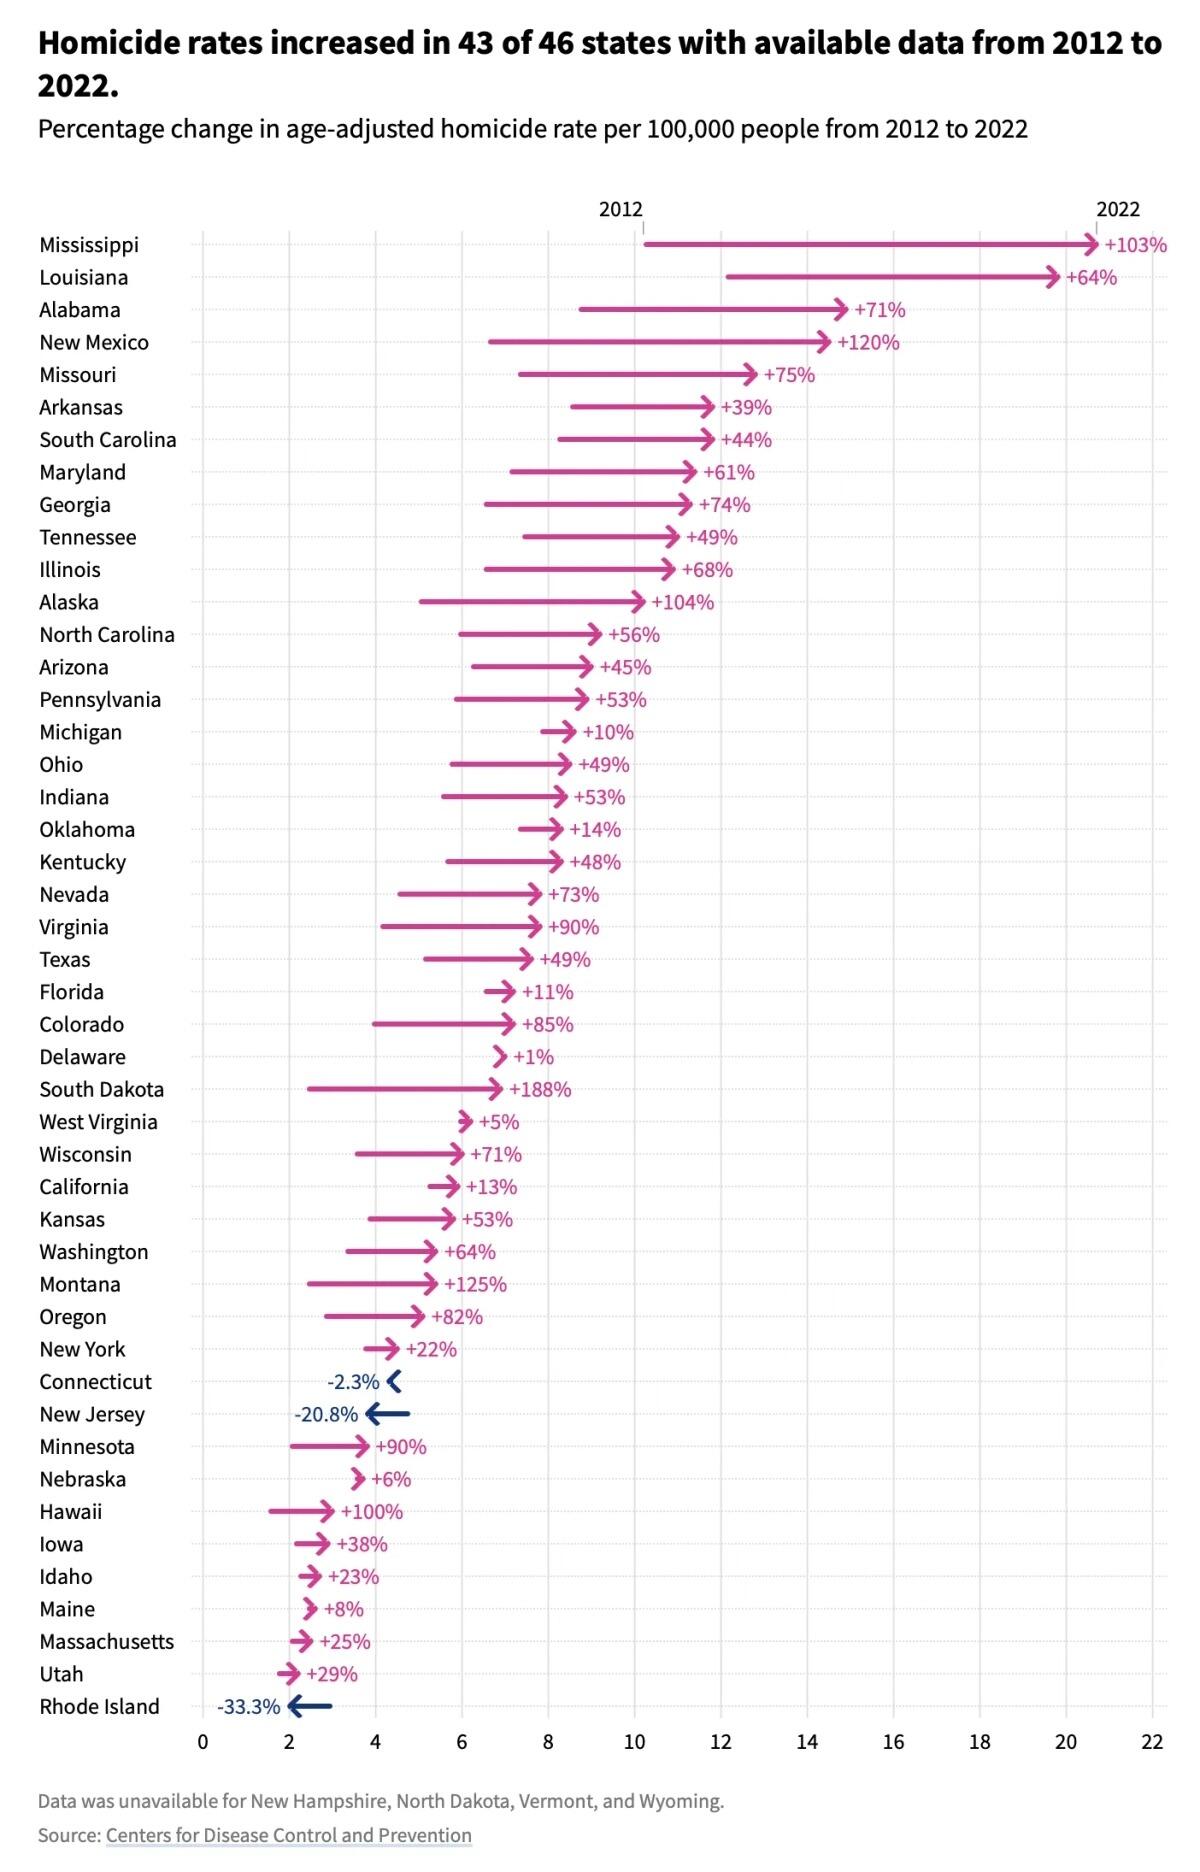
This graphic, via Visual Capitalist, from USAFacts examines the age-adjusted homicide rates by state from 2012 to 2022, and how they’ve changed. It uses CDC data available for 46 states, with no data available for New Hampshire, North Dakota, Vermont, and Wyoming.
Comparing States by Homicide Rates
From 2012 to 2022, homicide rates increased in every state with available data except for Connecticut, New Jersey, and Rhode Island. Here are the rates for all 46 available states as well as their 10-year change in percentage:
| State | Homicide rate (2022, age-adjusted per 100,000) | 10-Year Change (2012–2022) |
|---|---|---|
| Mississippi | 20.7 | +103% |
| Louisiana | 19.8 | +64% |
| Alabama | 14.9 | +71% |
| New Mexico | 14.5 | +120% |
| Missouri | 12.8 | +75% |
| Arkansas | 11.8 | +39% |
| South Carolina | 11.8 | +44% |
| Maryland | 11.4 | +61% |
| Georgia | 11.3 | +74% |
| Tennessee | 11.0 | +49% |
| Illinois | 10.9 | +68% |
| Alaska | 10.2 | +104% |
| North Carolina | 9.2 | +56% |
| Arizona | 9.0 | +45% |
| Pennsylvania | 8.9 | +53% |
| Michigan | 8.6 | +10% |
| Ohio | 8.5 | +49% |
| Indiana | 8.4 | +53% |
| Kentucky | 8.3 | +48% |
| Oklahoma | 8.3 | +14% |
| Nevada | 7.8 | +73% |
| Virginia | 7.8 | +90% |
| Texas | 7.6 | +49% |
| Colorado | 7.2 | +85% |
| Florida | 7.2 | +11% |
| Delaware | 7.0 | +1% |
| South Dakota | 6.9 | +188% |
| West Virginia | 6.2 | +5% |
| Wisconsin | 6.0 | +71% |
| California | 5.9 | +13% |
| Kansas | 5.8 | +53% |
| Montana | 5.4 | +125% |
| Washington | 5.4 | +64% |
| Oregon | 5.1 | +82% |
| New York | 4.5 | +22% |
| Connecticut | 4.3 | -2.3% |
| Minnesota | 3.8 | +90% |
| New Jersey | 3.8 | -20.8% |
| Nebraska | 3.7 | +6% |
| Hawaii | 3.0 | +100% |
| Iowa | 2.9 | +38% |
| Idaho | 2.7 | +23% |
| Maine | 2.6 | +8% |
| Massachusetts | 2.5 | +25% |
| Utah | 2.2 | +29% |
| Rhode Island | 2.0 | -33.3% |
Note: Age-adjusted data helps to compare health data over time or between groups more fairly by accounting for the age differences in populations.
Mississippi had the largest increase in homicide rate, more than doubling from 10.2 to 20.7 per 100,000 people. New Mexico (up 7.9 homicides per 100,000 people), Louisiana (up 7.7), Alabama (up 6.2), and Missouri (up 5.5) had the next-biggest increases.
Murder rates doubled in at least six states over the decade: South Dakota (+188%), Montana (+125%), New Mexico (+120%), Alaska (+104%), Mississippi (+103%), and Hawaii (+100%).
Are the United States getting more dangerous or more safe? The answer partially depends on your metric of choice.
For example, by examining homicide rates by state from 2012 to 2022, it can be seen that rates have increased almost across the board. That said, they are still lower than rates seen in the 1980s and 1990s.
This graphic, via Visual Capitalist, from USAFacts examines the age-adjusted homicide rates by state from 2012 to 2022, and how they’ve changed. It uses CDC data available for 46 states, with no data available for New Hampshire, North Dakota, Vermont, and Wyoming.

Comparing States by Homicide Rates
From 2012 to 2022, homicide rates increased in every state with available data except for Connecticut, New Jersey, and Rhode Island. Here are the rates for all 46 available states as well as their 10-year change in percentage:
| State | Homicide rate (2022, age-adjusted per 100,000) |
10-Year Change (2012–2022) |
|---|---|---|
| Mississippi | 20.7 | +103% |
| Louisiana | 19.8 | +64% |
| Alabama | 14.9 | +71% |
| New Mexico | 14.5 | +120% |
| Missouri | 12.8 | +75% |
| Arkansas | 11.8 | +39% |
| South Carolina | 11.8 | +44% |
| Maryland | 11.4 | +61% |
| Georgia | 11.3 | +74% |
| Tennessee | 11.0 | +49% |
| Illinois | 10.9 | +68% |
| Alaska | 10.2 | +104% |
| North Carolina | 9.2 | +56% |
| Arizona | 9.0 | +45% |
| Pennsylvania | 8.9 | +53% |
| Michigan | 8.6 | +10% |
| Ohio | 8.5 | +49% |
| Indiana | 8.4 | +53% |
| Kentucky | 8.3 | +48% |
| Oklahoma | 8.3 | +14% |
| Nevada | 7.8 | +73% |
| Virginia | 7.8 | +90% |
| Texas | 7.6 | +49% |
| Colorado | 7.2 | +85% |
| Florida | 7.2 | +11% |
| Delaware | 7.0 | +1% |
| South Dakota | 6.9 | +188% |
| West Virginia | 6.2 | +5% |
| Wisconsin | 6.0 | +71% |
| California | 5.9 | +13% |
| Kansas | 5.8 | +53% |
| Montana | 5.4 | +125% |
| Washington | 5.4 | +64% |
| Oregon | 5.1 | +82% |
| New York | 4.5 | +22% |
| Connecticut | 4.3 | -2.3% |
| Minnesota | 3.8 | +90% |
| New Jersey | 3.8 | -20.8% |
| Nebraska | 3.7 | +6% |
| Hawaii | 3.0 | +100% |
| Iowa | 2.9 | +38% |
| Idaho | 2.7 | +23% |
| Maine | 2.6 | +8% |
| Massachusetts | 2.5 | +25% |
| Utah | 2.2 | +29% |
| Rhode Island | 2.0 | -33.3% |
Note: Age-adjusted data helps to compare health data over time or between groups more fairly by accounting for the age differences in populations.
Mississippi had the largest increase in homicide rate, more than doubling from 10.2 to 20.7 per 100,000 people. New Mexico (up 7.9 homicides per 100,000 people), Louisiana (up 7.7), Alabama (up 6.2), and Missouri (up 5.5) had the next-biggest increases.
Murder rates doubled in at least six states over the decade: South Dakota (+188%), Montana (+125%), New Mexico (+120%), Alaska (+104%), Mississippi (+103%), and Hawaii (+100%).
Loading…