Authored by Lance Roberts via RealInvestmentAdvice.com,
New Coronavirus Discovery Shakes Markets
Last week, we discussed that continued bullish exuberance and high levels of complacency can quickly turn into volatility. As we noted then, introducing an unexpected, exogenous event can soon lead to a price decline if investors begin to reprice forward expectations. On Friday, that unexpected event presented itself when China, and most notoriously, the Wuhan Lab, reported the discovery of a new coronavirus in bats. To wit:
“Another coronavirus feared to be powerful enough to spread through humans has been discovered in China. In scenes eerily reminiscent of the beginnings of Covid, researchers at the infamous Wuhan Institute of Virology detected the new strain living within bats.
HKU5-CoV-2 is strikingly similar to the pandemic virus, sparking fears that history could repeat itself just two years after the worst was declared over. The new virus is even closer related to MERS, a deadlier type of coronavirus that kills up to a third of people it infects. Virologist Shi Zhengli, known as ‘Batwoman’ for her work on coronaviruses, led the discovery, published in a top scientific journal.”
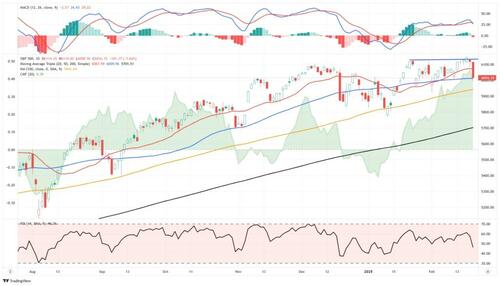
While this may or may not be an issue, it doesn’t take much to cause a market reversal when markets are elevated and highly bullish. As discussed last week, the market broke out of the bullish consolidation and set new record highs. However, that breakout was brief, and the news on Friday led to a retest of the 50-DMA and the triggering of the MACD “sell signal.” Such indeed suggests there could be more price pressure next week.
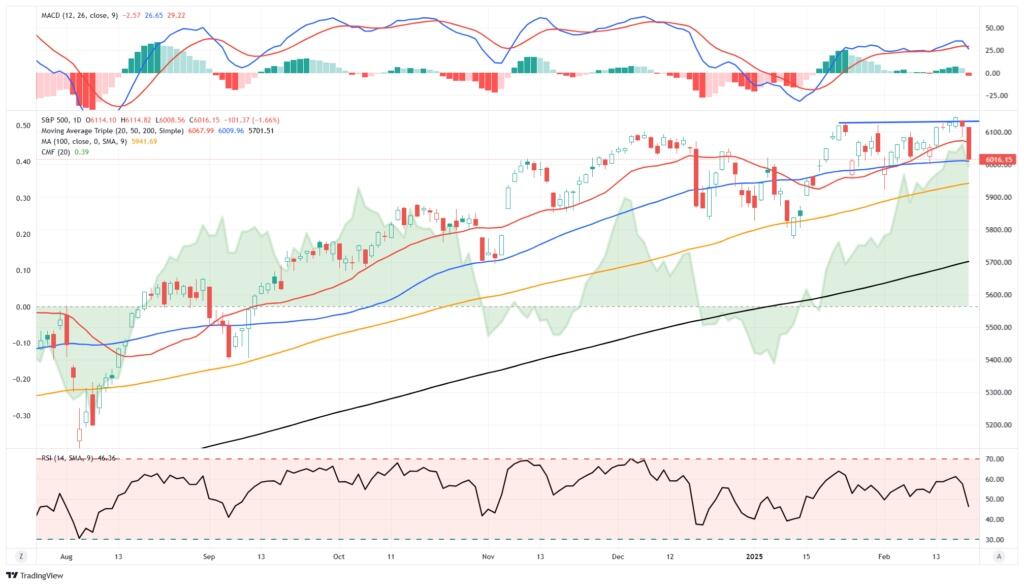
However, we want to give the market a few days to review the news. First, Friday was also an “options expiration” event, which added to the selling pressure in the market when the “virus” news hit. Secondly, the virus news will be thoroughly digested over the weekend and, by Monday, should be discounted in the markets. However, if the virus begins to replicate and spread, markets will have to evaluate further the risk to economic growth and earnings.
For now, we suspect markets will likely stabilize between the 50 and 100 DMA, reducing the bullish exuberance in the market. This will provide a better base on which to build as we enter the last three months of the seasonally strong period of the year. As noted previously, while there are certainly market risks, like sharp increases in leverage and speculation, there are currently no signs of that breaking—at least not yet.
Friday’s sell-off is precisely why we continue reiterating the need to rebalance risk and manage allocations.
Speaking of leverage, I want to expand on the margin debt discussion from Tuesday.
What Are Margin Balances And Why Are They Important?
On Tuesday, I touched on the continued increase in investor exuberance in the market. One sign of that exuberance is increases in margin balances. However, many may be unaware of what margin balances are and why they are noteworthy.
“Margin debt refers to the money an investor borrows from a brokerage firm to buy securities, using their existing portfolio as collateral. It allows investors to leverage their capital, meaning they can control more assets with a smaller upfront investment. While margin can amplify gains, it also increases risks, as losses are also magnified when markets decline.” – ChatGPT
When investors buy stocks on margin, they must deposit an initial amount (known as the initial margin), typically 50% of the purchase price per Regulation T set by the Federal Reserve. The brokerage firm lends the remaining balance.
For example, an investor with a $30,000 investment account invested in Apple (AAPL) can borrow up to $15,000 on margin to buy additional equities. However, using margin balances carries several risks.
- Margin Call – If the value of the securities drops below a certain level (the maintenance margin, usually 25%), the brokerage may issue a margin call, requiring the investor to deposit more funds or sell securities to cover losses.
- Amplified Losses – If an investor buys a stock on margin and it declines, they could lose more than their initial investment.
- Market Impact – High levels of margin debt in the market can contribute to bubbles and crashes. When markets decline sharply, forced liquidations from margin calls can lead to accelerated selling and increased volatility.
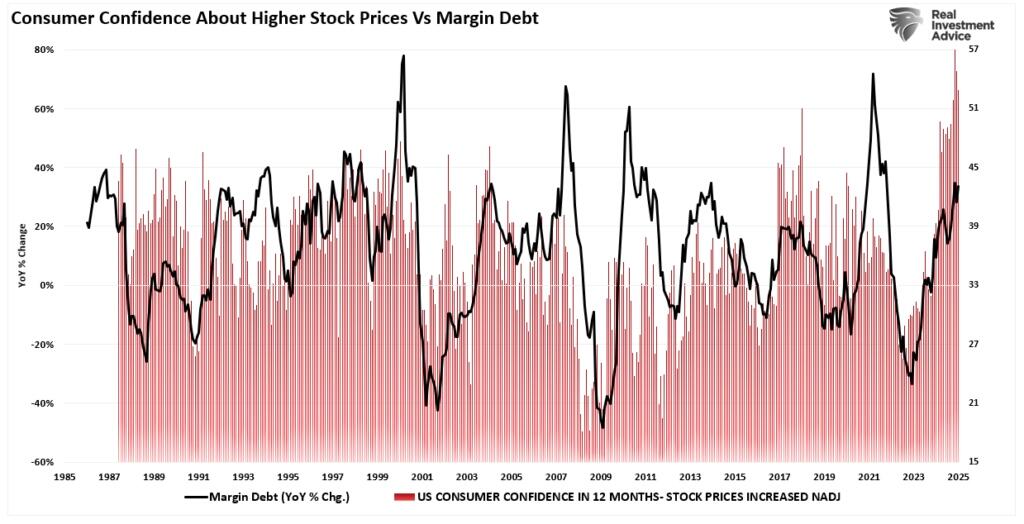
Margin balances represent the amount of speculation occurring in the market. In other words, margin debt is the “gasoline,” which drives markets higher as the leverage provides for the additional purchasing power of assets. However, leverage also works in reverse, as it supplies the accelerant for more significant declines as lenders “force” the sale of assets to cover credit lines without regard to the borrower’s position. As noted on Tuesday, it should be unsurprising that there is a high correlation between investor sentiment and margin balances.
The last sentence is the most important. The issue with margin debt is that the unwinding of leverage is NOT at the investor’s discretion. That process is at the discretion of the broker-dealers that extended that leverage in the first place. (In other words, if you don’t sell to cover, the broker-dealer will do it for you.) When lenders fear they may not recoup their credit lines, they force the borrower to put in more cash or sell assets to cover the debt. The problem is that “margin calls” generally happen simultaneously, as falling asset prices impact all lenders simultaneously.
Margin debt is NOT an issue – until it is.
So, where are we currently?
Margin Debt Confirms The Exuberance
I want to start with what I wrote in that previous post and then expand further into margin balances and the potential warning signal for investors. Let’s start where I left off.
“When we specifically look at margin debt, a loan against underlying collateral in brokerage accounts, those debt levels have surged to a record. As shown above, the year-over-year rate of change in debt is rising sharply but certainly can go further if retail exuberance continues.”
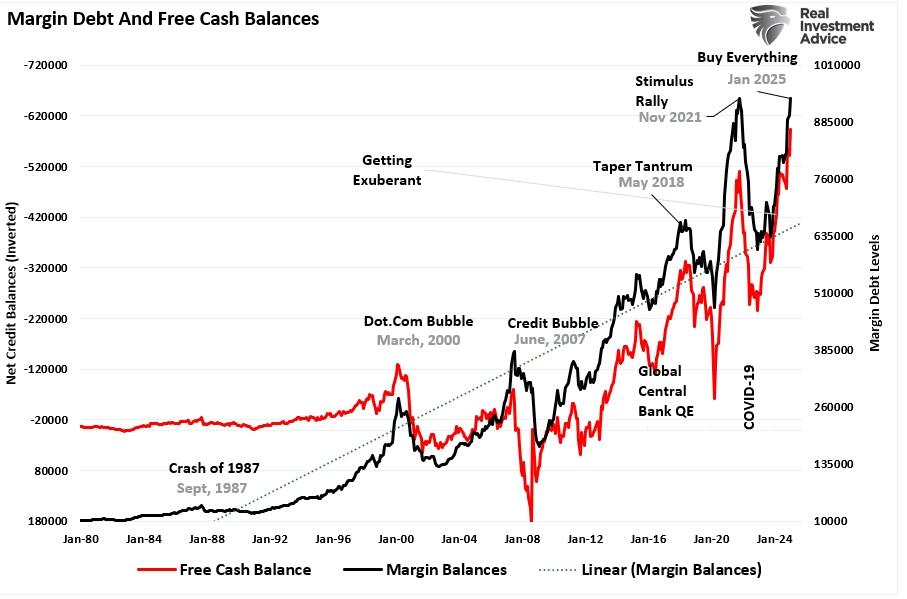
“However, look at the red line, “free cash balances.” As noted, margin debt supports the advance when markets rise as investors can leverage additional leverage to increase buying power. Therefore, the recent rise in margin debt is unsurprising as investor exuberance climbs. The chart below shows the relationship between cash balances and the market. I have inverted free cash balances, so the relationship between increases in margin debt and the market is better represented. (Free cash balances are the difference between margin balances less cash and credit balances in margin accounts.).“
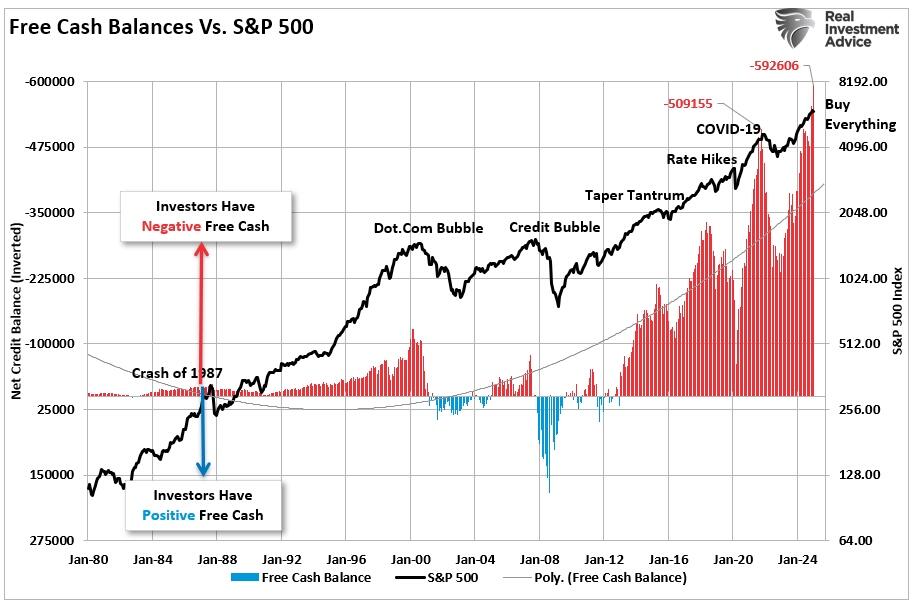
“Note that during the 1987 correction, the 2015-2016 “Brexit/Taper Tantrum,” the 2018 “Rate Hike Mistake,” and the “COVID Dip,” the market never broke its uptrend, AND cash balances never turned positive. Both a break of the rising bullish trend and positive free cash balances were the 2000 and 2008 bear market hallmarks. With negative cash balances at another all-time high, the next downturn could be another “correction.” However, if, or when, the long-term bullish trend is broken, the unwinding of margin debt will add “fuel to the fire.”
As noted, rising leverage is the “fuel” for bull market advances. What makes rising margin debt levels more dangerous is when retail exuberance feeds into all risk assets simultaneously.
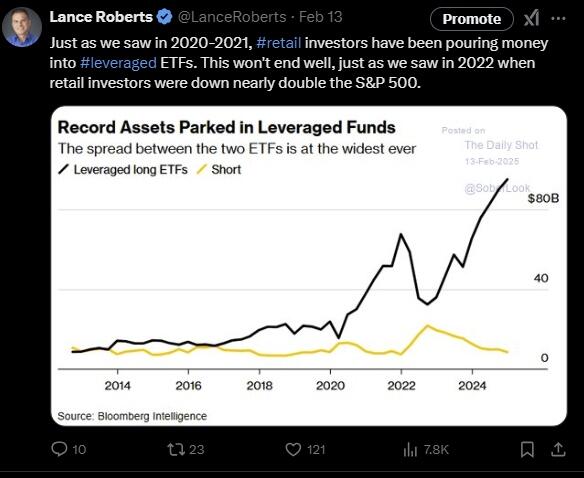
While the increase in margin balances is alarming, it is even more concerning when we remember that retail investors are also piling into leverage ETFs and options (another form of leverage) at a frightening pace. As I posted on X this past week, retail investor allocations to ETFs now exceed levels seen in 2021.
In other words, the amount of leverage in the system today is far more significant than represented solely by margin balances. Nonetheless, that increase in risk-taking has fundamentally supported stock prices in recent months.
However, when discussing margin balances, I often get questions about the “rate of the increase.”
A Need For Speed
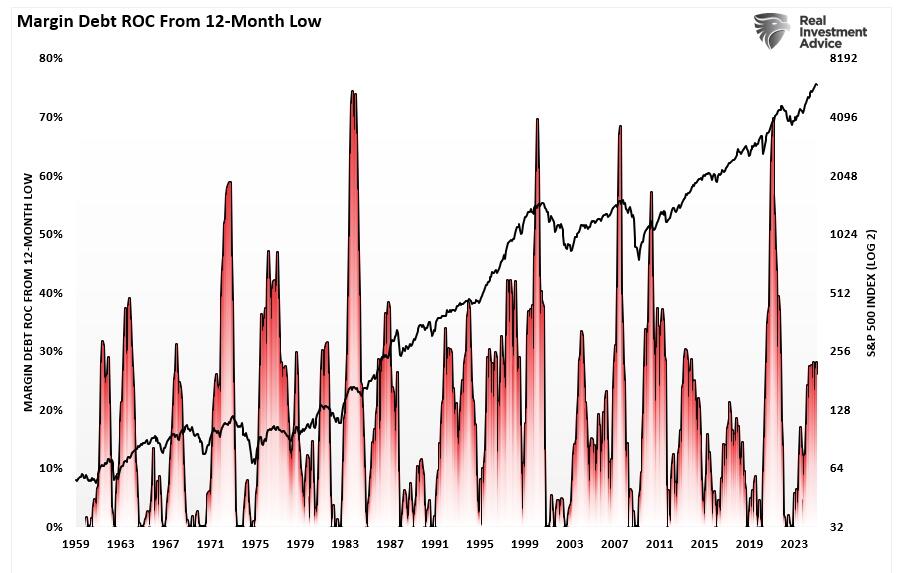
The “rate of increase” is a crucial factor concerning margin balances. If the market is rising, and margin balances are slowly increasing over time, such does not provide a good indication of “investor greed.” Margin balances should be expected to increase over time as the market grows. However, if the rate of increase is sharp, that is a stronger indication that investors are becoming exuberant, which is typical of late-stage market advances. One measure we track is the rate of change from the margin balance’s lowest point over the last 12 months. Unsurprisingly, margin balances have risen 30% from those lows. While current levels of increase are not as high as previous ones, the increase does show the rise in investor “greed” in recent months.
We can also apply technical analysis to margin balances to study the rate of change in debt levels.
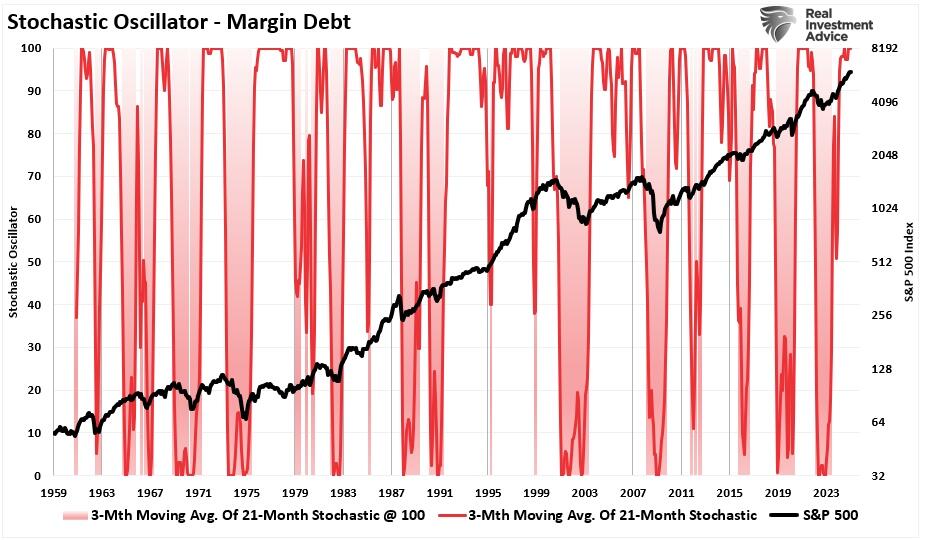
Margin data goes back to 1959, giving us a lot of history to study its relationship to the market. The chart below is a “stochastic indicator” of margin debt overlaid against the S&P 500. (The stochastic indicator is a momentum indicator developed by George C. Lane in the 1950s. The analysis examines the most recent margin debt level relative to its previous high-low range. In other words, the indicator measures the momentum of margin debt by comparing the closing level with the range over the past 21 months.)
The stochastic indicator represents the speed and momentum of margin debt level changes. This means the stochastic indicator changes direction before the market, making it a leading indicator. The stochastic indicator at 100 (its maximum level) has typically preceded a market reversal and represents the sharp increase in investor risk-taking.
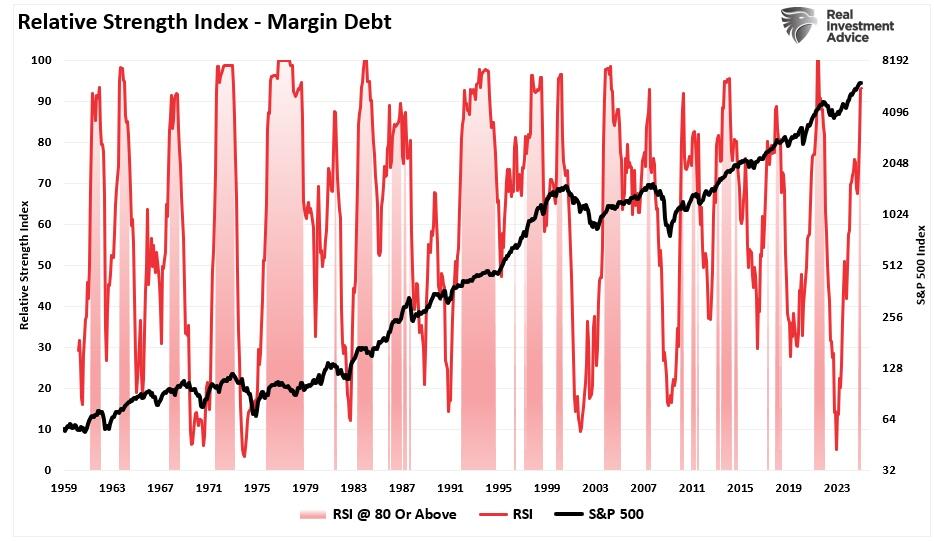
We see the same when we apply a Relative Strength Index to margin balances. The relative strength index (RSI)) is a momentum oscillator measuring the velocity and magnitude of changes to margin balances. Readings above 80 have typically preceded short to intermediate-term corrections or consolidations. With a current reading above 90, the increase in margin balances since October 2022 is notable.
As noted, it isn’t just investors’ “sentiment” that is exuberant. Yes, investors are very confident that stock prices will be higher. Crucially, not only are they confident, but they are aggressively allocating money toward risk and doing it with leverage.
However, that increase in leverage is essential to pushing asset prices higher.
It is also a warning.
Watching For The Warning Sign
I want to make a crucial point here. Margin debt, like valuations, is a “terrible market timing” indicator and should not be used as such.
Rising levels of margin debt measure investor confidence. Investors are more willing to take out debt against investments when shares are rising, and they have more value in their portfolios against which they can borrow. However, as noted above, the risk is when falling asset prices reduce the amount of credit available. The subsequent liquidation of assets must occur to bring the account back into balance.
I agree and disagree that margin debt levels are simply a function of market activity and have no bearing on the market outcome.
In March 2020, the double-whammy of collapsing oil prices and economic shutdown in response to the coronavirus triggered a sharp sell-off fueled by margin liquidation. Most investors have forgotten about 2020 or, worse, assume it can’t happen again for various short-sighted reasons. However, the “gas tank” is once again full as investors are more exuberant now than at the market’s peak in 2021.
One warning sign that has been a good indicator to reduce portfolio risk is when the margin balances fall below the 12-month moving average. Margin balances are well above that level, keeping portfolios allocated toward equity risk. However, previously, when that warning signal was triggered, markets spent time either consolidating or correcting.

Sure, this time could indeed be different. That has remained investors’ “siren song” throughout history. However, as Sentiment Trader summed up the last time we wrote on this topic, such is usually untrue.
“Whenever some of this data fails to lead to the expected outcome for a few weeks or more, we hear the usual chorus of opinions about why it doesn’t work anymore. This has been consistent for 20 years, like…
- Decimalization will destroy all breadth figures (2000)
- The terror attacks will permanently alter investors’ time preferences (2001)
- The pricking of the internet bubble will forever change option skews (2002)
- Easy money will render sentiment indicators useless (2007)
- The financial crisis means relying on any historical precedents are invalid (2008)
- The Fed’s interventions mean any indicators are no longer useful (2010 – present)
All of these sound good, and for a time it seemed like they were accurate. Then markets would revert and the arguments would get swept into the dustbins of history.”
We are not suggesting that margin balances are warning of an imminent crash. However, they indicate that investors are very exuberant about future market returns and have taken on increased risk. More notably, they are doing so this time by leveraging investments with additional leverage.
When the market does reverse, the devastation to many investors will likely be much more immense than most assume.
How We Are Trading It
While we remain long-biased in our equity portfolios, we have begun to reduce some of our big winners (take profits) and continue to add to our more defensive-oriented positions. While we certainly want to participate in the market’s current upside, we will also give up some gains to protect against the eventual reversion.
Although it certainly “feels” like the market “just won’t go down,” it is worth remembering Warren Buffett’s sage words.
“The market is a lot like sex, it feels best at the end.”
In the short term, holding higher cash levels will indeed provide some drag between our portfolio and the major market index. However, if an event hits the markets, our preparation should protect us against the initial “bite.”
We remain “bullish” on the markets, as momentum is still in play. However, we are taking precautionary actions for the “just in case” scenario.
To spin a bit of Warren’s quote:
“If you engage in the market in an unprotected fashion, you may not want the unexpected surprise.”
Given the market uncertainty, the high levels of complacency, and the risks to stability, managing portfolio risks is worth considering. That is why we have started rebalancing portfolio risk accordingly. With both technical and sentiment readings suggesting the short-term market risks are elevated, taking some “small” actions now is wise, which you will likely appreciate later.
- Tighten up stop-loss levels to current support levels for each position.
- Hedge portfolios against more significant market declines.
- Take profits in positions that have been big winners.
- Sell laggards and losers.
- Raise cash and rebalance portfolios to target weightings.
Therefore, from a portfolio management perspective, we have to trade the market we have rather than the one we think should be. This can make battling emotions difficult from week to week. However, as noted, we expect a correction sooner rather than later, providing a better risk/reward opportunity to increase equity exposure if needed.
Authored by Lance Roberts via RealInvestmentAdvice.com,
New Coronavirus Discovery Shakes Markets
Last week, we discussed that continued bullish exuberance and high levels of complacency can quickly turn into volatility. As we noted then, introducing an unexpected, exogenous event can soon lead to a price decline if investors begin to reprice forward expectations. On Friday, that unexpected event presented itself when China, and most notoriously, the Wuhan Lab, reported the discovery of a new coronavirus in bats. To wit:
“Another coronavirus feared to be powerful enough to spread through humans has been discovered in China. In scenes eerily reminiscent of the beginnings of Covid, researchers at the infamous Wuhan Institute of Virology detected the new strain living within bats.
HKU5-CoV-2 is strikingly similar to the pandemic virus, sparking fears that history could repeat itself just two years after the worst was declared over. The new virus is even closer related to MERS, a deadlier type of coronavirus that kills up to a third of people it infects. Virologist Shi Zhengli, known as ‘Batwoman’ for her work on coronaviruses, led the discovery, published in a top scientific journal.”
While this may or may not be an issue, it doesn’t take much to cause a market reversal when markets are elevated and highly bullish. As discussed last week, the market broke out of the bullish consolidation and set new record highs. However, that breakout was brief, and the news on Friday led to a retest of the 50-DMA and the triggering of the MACD “sell signal.” Such indeed suggests there could be more price pressure next week.

However, we want to give the market a few days to review the news. First, Friday was also an “options expiration” event, which added to the selling pressure in the market when the “virus” news hit. Secondly, the virus news will be thoroughly digested over the weekend and, by Monday, should be discounted in the markets. However, if the virus begins to replicate and spread, markets will have to evaluate further the risk to economic growth and earnings.
For now, we suspect markets will likely stabilize between the 50 and 100 DMA, reducing the bullish exuberance in the market. This will provide a better base on which to build as we enter the last three months of the seasonally strong period of the year. As noted previously, while there are certainly market risks, like sharp increases in leverage and speculation, there are currently no signs of that breaking—at least not yet.
Friday’s sell-off is precisely why we continue reiterating the need to rebalance risk and manage allocations.
Speaking of leverage, I want to expand on the margin debt discussion from Tuesday.
What Are Margin Balances And Why Are They Important?
On Tuesday, I touched on the continued increase in investor exuberance in the market. One sign of that exuberance is increases in margin balances. However, many may be unaware of what margin balances are and why they are noteworthy.
“Margin debt refers to the money an investor borrows from a brokerage firm to buy securities, using their existing portfolio as collateral. It allows investors to leverage their capital, meaning they can control more assets with a smaller upfront investment. While margin can amplify gains, it also increases risks, as losses are also magnified when markets decline.” – ChatGPT
When investors buy stocks on margin, they must deposit an initial amount (known as the initial margin), typically 50% of the purchase price per Regulation T set by the Federal Reserve. The brokerage firm lends the remaining balance.
For example, an investor with a $30,000 investment account invested in Apple (AAPL) can borrow up to $15,000 on margin to buy additional equities. However, using margin balances carries several risks.
- Margin Call – If the value of the securities drops below a certain level (the maintenance margin, usually 25%), the brokerage may issue a margin call, requiring the investor to deposit more funds or sell securities to cover losses.
- Amplified Losses – If an investor buys a stock on margin and it declines, they could lose more than their initial investment.
- Market Impact – High levels of margin debt in the market can contribute to bubbles and crashes. When markets decline sharply, forced liquidations from margin calls can lead to accelerated selling and increased volatility.
Margin balances represent the amount of speculation occurring in the market. In other words, margin debt is the “gasoline,” which drives markets higher as the leverage provides for the additional purchasing power of assets. However, leverage also works in reverse, as it supplies the accelerant for more significant declines as lenders “force” the sale of assets to cover credit lines without regard to the borrower’s position. As noted on Tuesday, it should be unsurprising that there is a high correlation between investor sentiment and margin balances.

The last sentence is the most important. The issue with margin debt is that the unwinding of leverage is NOT at the investor’s discretion. That process is at the discretion of the broker-dealers that extended that leverage in the first place. (In other words, if you don’t sell to cover, the broker-dealer will do it for you.) When lenders fear they may not recoup their credit lines, they force the borrower to put in more cash or sell assets to cover the debt. The problem is that “margin calls” generally happen simultaneously, as falling asset prices impact all lenders simultaneously.
Margin debt is NOT an issue – until it is.
So, where are we currently?
Margin Debt Confirms The Exuberance
I want to start with what I wrote in that previous post and then expand further into margin balances and the potential warning signal for investors. Let’s start where I left off.
“When we specifically look at margin debt, a loan against underlying collateral in brokerage accounts, those debt levels have surged to a record. As shown above, the year-over-year rate of change in debt is rising sharply but certainly can go further if retail exuberance continues.”

“However, look at the red line, “free cash balances.” As noted, margin debt supports the advance when markets rise as investors can leverage additional leverage to increase buying power. Therefore, the recent rise in margin debt is unsurprising as investor exuberance climbs. The chart below shows the relationship between cash balances and the market. I have inverted free cash balances, so the relationship between increases in margin debt and the market is better represented. (Free cash balances are the difference between margin balances less cash and credit balances in margin accounts.).“

“Note that during the 1987 correction, the 2015-2016 “Brexit/Taper Tantrum,” the 2018 “Rate Hike Mistake,” and the “COVID Dip,” the market never broke its uptrend, AND cash balances never turned positive. Both a break of the rising bullish trend and positive free cash balances were the 2000 and 2008 bear market hallmarks. With negative cash balances at another all-time high, the next downturn could be another “correction.” However, if, or when, the long-term bullish trend is broken, the unwinding of margin debt will add “fuel to the fire.”
As noted, rising leverage is the “fuel” for bull market advances. What makes rising margin debt levels more dangerous is when retail exuberance feeds into all risk assets simultaneously.
While the increase in margin balances is alarming, it is even more concerning when we remember that retail investors are also piling into leverage ETFs and options (another form of leverage) at a frightening pace. As I posted on X this past week, retail investor allocations to ETFs now exceed levels seen in 2021.

In other words, the amount of leverage in the system today is far more significant than represented solely by margin balances. Nonetheless, that increase in risk-taking has fundamentally supported stock prices in recent months.
However, when discussing margin balances, I often get questions about the “rate of the increase.”
A Need For Speed
The “rate of increase” is a crucial factor concerning margin balances. If the market is rising, and margin balances are slowly increasing over time, such does not provide a good indication of “investor greed.” Margin balances should be expected to increase over time as the market grows. However, if the rate of increase is sharp, that is a stronger indication that investors are becoming exuberant, which is typical of late-stage market advances. One measure we track is the rate of change from the margin balance’s lowest point over the last 12 months. Unsurprisingly, margin balances have risen 30% from those lows. While current levels of increase are not as high as previous ones, the increase does show the rise in investor “greed” in recent months.

We can also apply technical analysis to margin balances to study the rate of change in debt levels.
Margin data goes back to 1959, giving us a lot of history to study its relationship to the market. The chart below is a “stochastic indicator” of margin debt overlaid against the S&P 500. (The stochastic indicator is a momentum indicator developed by George C. Lane in the 1950s. The analysis examines the most recent margin debt level relative to its previous high-low range. In other words, the indicator measures the momentum of margin debt by comparing the closing level with the range over the past 21 months.)
The stochastic indicator represents the speed and momentum of margin debt level changes. This means the stochastic indicator changes direction before the market, making it a leading indicator. The stochastic indicator at 100 (its maximum level) has typically preceded a market reversal and represents the sharp increase in investor risk-taking.

We see the same when we apply a Relative Strength Index to margin balances. The relative strength index (RSI)) is a momentum oscillator measuring the velocity and magnitude of changes to margin balances. Readings above 80 have typically preceded short to intermediate-term corrections or consolidations. With a current reading above 90, the increase in margin balances since October 2022 is notable.

As noted, it isn’t just investors’ “sentiment” that is exuberant. Yes, investors are very confident that stock prices will be higher. Crucially, not only are they confident, but they are aggressively allocating money toward risk and doing it with leverage.
However, that increase in leverage is essential to pushing asset prices higher.
It is also a warning.
Watching For The Warning Sign
I want to make a crucial point here. Margin debt, like valuations, is a “terrible market timing” indicator and should not be used as such.
Rising levels of margin debt measure investor confidence. Investors are more willing to take out debt against investments when shares are rising, and they have more value in their portfolios against which they can borrow. However, as noted above, the risk is when falling asset prices reduce the amount of credit available. The subsequent liquidation of assets must occur to bring the account back into balance.
I agree and disagree that margin debt levels are simply a function of market activity and have no bearing on the market outcome.
In March 2020, the double-whammy of collapsing oil prices and economic shutdown in response to the coronavirus triggered a sharp sell-off fueled by margin liquidation. Most investors have forgotten about 2020 or, worse, assume it can’t happen again for various short-sighted reasons. However, the “gas tank” is once again full as investors are more exuberant now than at the market’s peak in 2021.
One warning sign that has been a good indicator to reduce portfolio risk is when the margin balances fall below the 12-month moving average. Margin balances are well above that level, keeping portfolios allocated toward equity risk. However, previously, when that warning signal was triggered, markets spent time either consolidating or correcting.

Sure, this time could indeed be different. That has remained investors’ “siren song” throughout history. However, as Sentiment Trader summed up the last time we wrote on this topic, such is usually untrue.
“Whenever some of this data fails to lead to the expected outcome for a few weeks or more, we hear the usual chorus of opinions about why it doesn’t work anymore. This has been consistent for 20 years, like…
- Decimalization will destroy all breadth figures (2000)
- The terror attacks will permanently alter investors’ time preferences (2001)
- The pricking of the internet bubble will forever change option skews (2002)
- Easy money will render sentiment indicators useless (2007)
- The financial crisis means relying on any historical precedents are invalid (2008)
- The Fed’s interventions mean any indicators are no longer useful (2010 – present)
All of these sound good, and for a time it seemed like they were accurate. Then markets would revert and the arguments would get swept into the dustbins of history.”
We are not suggesting that margin balances are warning of an imminent crash. However, they indicate that investors are very exuberant about future market returns and have taken on increased risk. More notably, they are doing so this time by leveraging investments with additional leverage.
When the market does reverse, the devastation to many investors will likely be much more immense than most assume.
How We Are Trading It
While we remain long-biased in our equity portfolios, we have begun to reduce some of our big winners (take profits) and continue to add to our more defensive-oriented positions. While we certainly want to participate in the market’s current upside, we will also give up some gains to protect against the eventual reversion.
Although it certainly “feels” like the market “just won’t go down,” it is worth remembering Warren Buffett’s sage words.
“The market is a lot like sex, it feels best at the end.”
In the short term, holding higher cash levels will indeed provide some drag between our portfolio and the major market index. However, if an event hits the markets, our preparation should protect us against the initial “bite.”
We remain “bullish” on the markets, as momentum is still in play. However, we are taking precautionary actions for the “just in case” scenario.
To spin a bit of Warren’s quote:
“If you engage in the market in an unprotected fashion, you may not want the unexpected surprise.”
Given the market uncertainty, the high levels of complacency, and the risks to stability, managing portfolio risks is worth considering. That is why we have started rebalancing portfolio risk accordingly. With both technical and sentiment readings suggesting the short-term market risks are elevated, taking some “small” actions now is wise, which you will likely appreciate later.
- Tighten up stop-loss levels to current support levels for each position.
- Hedge portfolios against more significant market declines.
- Take profits in positions that have been big winners.
- Sell laggards and losers.
- Raise cash and rebalance portfolios to target weightings.
Therefore, from a portfolio management perspective, we have to trade the market we have rather than the one we think should be. This can make battling emotions difficult from week to week. However, as noted, we expect a correction sooner rather than later, providing a better risk/reward opportunity to increase equity exposure if needed.
Loading…