According to the latest data published by the United Nations, the number of international migrants amounted to 281 million in 2020, which is equivalent to 3.6 percent of the world's population.
By "migrant", it is meant: Any person who, leaving his or her usual place of residence, crosses an international border, regardless of the nature and cause of the movement or the duration of the stay.
The census therefore covers a wide range of circumstances and includes both war and economic refugees - estimated at more than 82 million - and voluntary migrants: workers, students, retirees, etc.
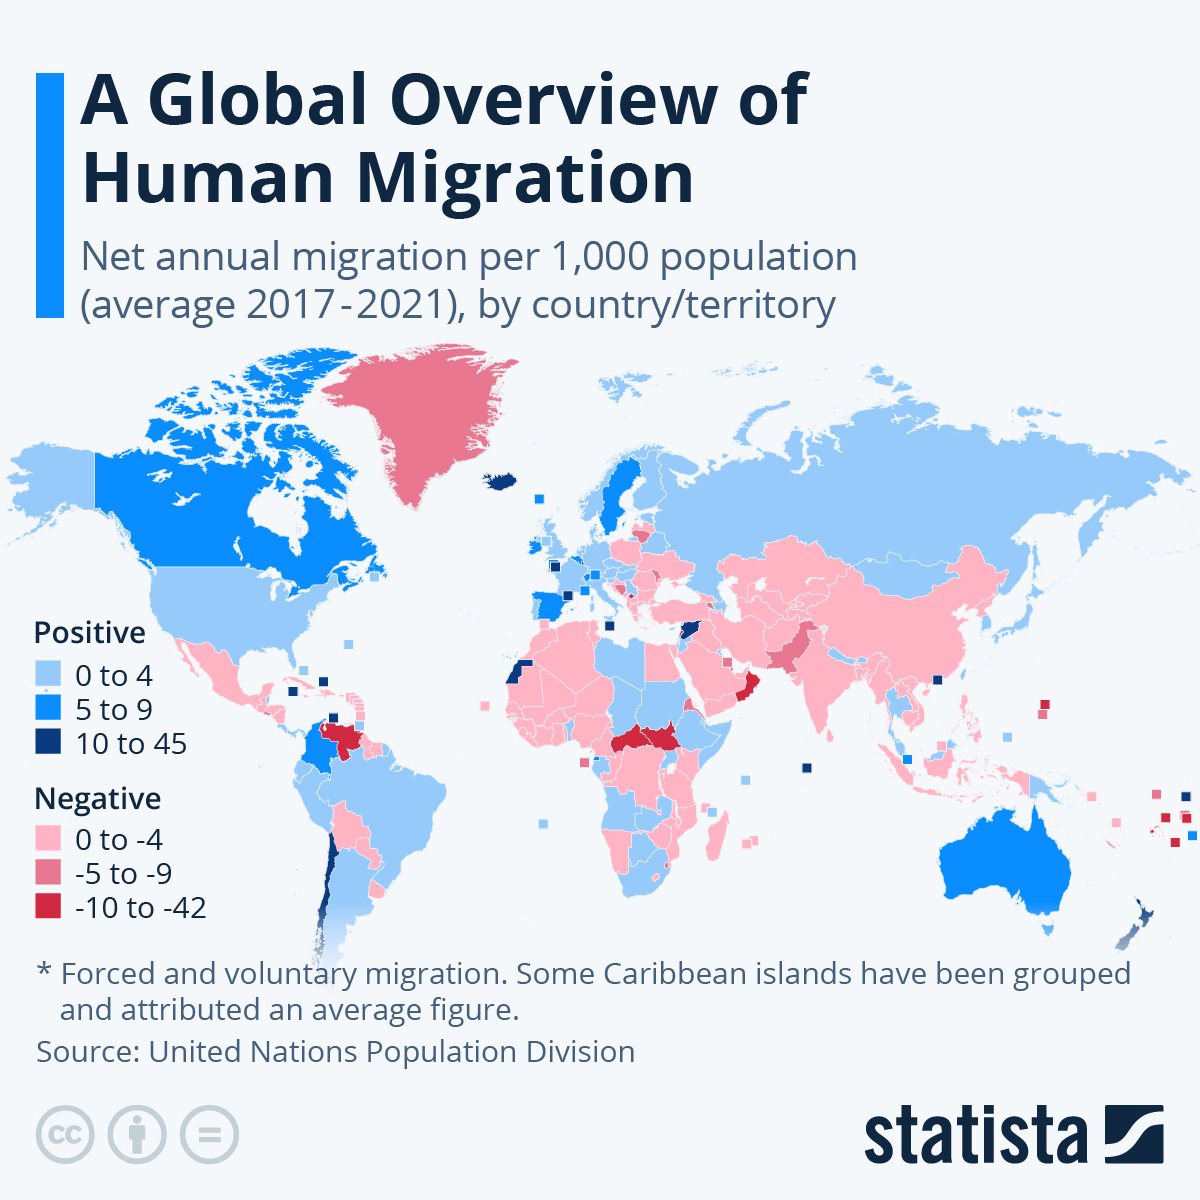
This map by Statista's Martin Armstrong provides an overview of the migration trends in the world...
You will find more infographics at Statista
It shows the annual net migration (arrivals minus departures) of all countries and territories, relative to their population size.
Between 2017 and 2021, the regions of the world that lost the largest share of people via emigration were the Marshall Islands and American Samoa in the Pacific Ocean, followed by Lebanon and Venezuela.
During this period, these four territories, some of which are experiencing severe economic hardship, experienced an average net loss of 28 to 42 inhabitants per 1,000 people per year.
In contrast, the regions that attracted the most migrants relative to their population size were the New Zealand-administered Tokelau Archipelago, the Caribbean tax haven of the Turks and Caicos Islands and, in Europe, Malta.
For these three places, the average annual net migration was between 22 and 45 additional persons per 1,000 inhabitants.
According to the latest data published by the United Nations, the number of international migrants amounted to 281 million in 2020, which is equivalent to 3.6 percent of the world’s population.
By “migrant”, it is meant: Any person who, leaving his or her usual place of residence, crosses an international border, regardless of the nature and cause of the movement or the duration of the stay.
The census therefore covers a wide range of circumstances and includes both war and economic refugees – estimated at more than 82 million – and voluntary migrants: workers, students, retirees, etc.
This map by Statista’s Martin Armstrong provides an overview of the migration trends in the world…
You will find more infographics at Statista
It shows the annual net migration (arrivals minus departures) of all countries and territories, relative to their population size.
Between 2017 and 2021, the regions of the world that lost the largest share of people via emigration were the Marshall Islands and American Samoa in the Pacific Ocean, followed by Lebanon and Venezuela.
During this period, these four territories, some of which are experiencing severe economic hardship, experienced an average net loss of 28 to 42 inhabitants per 1,000 people per year.
In contrast, the regions that attracted the most migrants relative to their population size were the New Zealand-administered Tokelau Archipelago, the Caribbean tax haven of the Turks and Caicos Islands and, in Europe, Malta.
For these three places, the average annual net migration was between 22 and 45 additional persons per 1,000 inhabitants.


