Authored by Simon White, Bloomberg macro-strategist,
The macro landscape is changing. Inflation will remain in an elevated and unstable regime, but the first stage of the crisis is drawing to a close. That means the dollar in a downward trend, bonds in an upward trend, stocks underperforming bonds, and growth outperforming value.
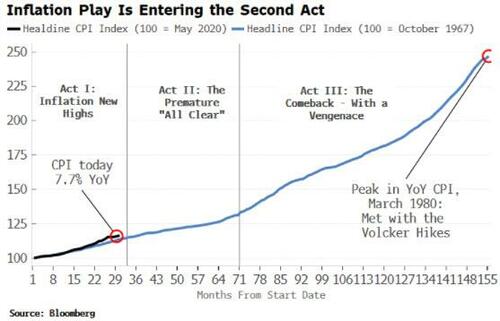
Regime shifts can be almost imperceptible in real time, but in retrospect they mark fundamental turning points. Inflation today is going through one of these shifts, analogous to the 1970s. In that decade, inflation could be understood as a play in three acts, a drama that is likely to be repeated in this cycle.
-
In the first act, inflation makes new highs and the Fed tightens aggressively.
-
The second is when inflation begins to recede, allowing the central bank to pull back from tightening.
-
The final act is when we see inflation return with a vengeance, eliciting a Volcker-esque monetary response and a deep recession in order to fully snuff it out.
So what’s brought the curtain down on the first act? Three important indicators have made a decisive turn:
-
The market is now ahead of the Fed’s rate projections (the Dots)
-
The real yield curve is emphatically flattening
-
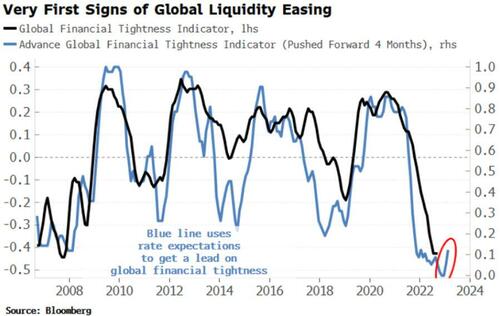
My Advanced Global Financial Tightness Indicator (AGFTI) is rising
All through this cycle, the market has been anticipating a lower peak rate than desired by FOMC members. That changed in the last couple of months, signaling that Fed hawkishness was peaking as the market was amplifying -- not inhibiting -- the Fed’s intended policy.
The real yield curve had steepened relentlessly as shorter-term real rates kept falling while the Fed rate lagged inflation. But the trend definitively turned in July, pointing to a peak in the dollar. The greenback’s rise has been one of the defining aspects of the macro environment over the last 18 months, and its turn lower signifies an easing of pressure on, most significantly, EM equities and commodities.
Global monetary conditions are likely at their tightest.
It’s not just the Fed that has been raising rates; central banks globally have been doing likewise. However, even though many began to raise rates after the Fed, any sign the US may not need to tighten much further will be enough to let other central banks take their foot off the monetary brake too.
What does the second act in the Inflation Play mean for asset prices? As just mentioned, the flattening in the real yield curve indicates the dollar has likely peaked for now. This opens up room for greater support in the euro, yen and sterling as most of the weakening in these currencies can be attributed to dollar strength.
Treasuries should see more upside. As well as a more economy-friendly Fed, higher US short-term yields have stifled foreign demand for Treasuries, while both positioning and seasonal factors are very favorable for them.
Stocks will face less formidable headwinds, but until excess liquidity begins to definitively turn up and the looming threat of a recession persists they will continue to be stuck in a bear market, facing the risk of sharp sell-offs. That being said, recent price action points to a bias for upward surprises in the short-to-medium term.
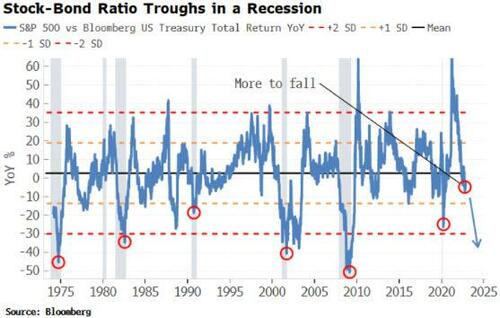
What is more certain is that stocks will continue to underperform bonds.
The stock-bond ratio remains only marginally below its fair value, and tends to overshoot to the downside, reaching its nadir in the depths of the recession.
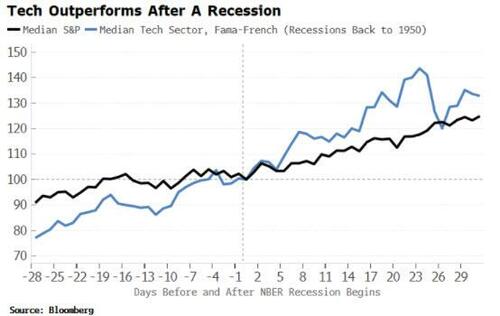
Within stocks, though, there should now be a window where growth starts outperforming value again. Growth stocks, especially tech, have lagged and have been the worst performing sectors. A change of regime and the rising threat of a recession likely means potential for tech to outperform. As the chart below shows, tech tends to underperform before a recession, and outperform afterward.
A warning: the second act is only an intermission before inflation and higher rates return for the finale. Positions should be rented, not owned.
Authored by Simon White, Bloomberg macro-strategist,
The macro landscape is changing. Inflation will remain in an elevated and unstable regime, but the first stage of the crisis is drawing to a close. That means the dollar in a downward trend, bonds in an upward trend, stocks underperforming bonds, and growth outperforming value.
Regime shifts can be almost imperceptible in real time, but in retrospect they mark fundamental turning points. Inflation today is going through one of these shifts, analogous to the 1970s. In that decade, inflation could be understood as a play in three acts, a drama that is likely to be repeated in this cycle.
-
In the first act, inflation makes new highs and the Fed tightens aggressively.
-
The second is when inflation begins to recede, allowing the central bank to pull back from tightening.
-
The final act is when we see inflation return with a vengeance, eliciting a Volcker-esque monetary response and a deep recession in order to fully snuff it out.
So what’s brought the curtain down on the first act? Three important indicators have made a decisive turn:
-
The market is now ahead of the Fed’s rate projections (the Dots)
-
The real yield curve is emphatically flattening
-
My Advanced Global Financial Tightness Indicator (AGFTI) is rising
All through this cycle, the market has been anticipating a lower peak rate than desired by FOMC members. That changed in the last couple of months, signaling that Fed hawkishness was peaking as the market was amplifying — not inhibiting — the Fed’s intended policy.
The real yield curve had steepened relentlessly as shorter-term real rates kept falling while the Fed rate lagged inflation. But the trend definitively turned in July, pointing to a peak in the dollar. The greenback’s rise has been one of the defining aspects of the macro environment over the last 18 months, and its turn lower signifies an easing of pressure on, most significantly, EM equities and commodities.
Global monetary conditions are likely at their tightest.
It’s not just the Fed that has been raising rates; central banks globally have been doing likewise. However, even though many began to raise rates after the Fed, any sign the US may not need to tighten much further will be enough to let other central banks take their foot off the monetary brake too.
What does the second act in the Inflation Play mean for asset prices? As just mentioned, the flattening in the real yield curve indicates the dollar has likely peaked for now. This opens up room for greater support in the euro, yen and sterling as most of the weakening in these currencies can be attributed to dollar strength.
Treasuries should see more upside. As well as a more economy-friendly Fed, higher US short-term yields have stifled foreign demand for Treasuries, while both positioning and seasonal factors are very favorable for them.
Stocks will face less formidable headwinds, but until excess liquidity begins to definitively turn up and the looming threat of a recession persists they will continue to be stuck in a bear market, facing the risk of sharp sell-offs. That being said, recent price action points to a bias for upward surprises in the short-to-medium term.
What is more certain is that stocks will continue to underperform bonds.
The stock-bond ratio remains only marginally below its fair value, and tends to overshoot to the downside, reaching its nadir in the depths of the recession.
Within stocks, though, there should now be a window where growth starts outperforming value again. Growth stocks, especially tech, have lagged and have been the worst performing sectors. A change of regime and the rising threat of a recession likely means potential for tech to outperform. As the chart below shows, tech tends to underperform before a recession, and outperform afterward.
A warning: the second act is only an intermission before inflation and higher rates return for the finale. Positions should be rented, not owned.


