By Tony Pasquariello, Goldman head of hedge fund sales
For only the third time since 1926, both US stocks and bonds lost money in 2022 (the other two occurrences were 1931 and 1969).
The intra-year path was extraordinary -- be it the high print on inflation (I wonder when we’ll see a 9.1% headline on CPI again), the Fed’s response (425 bps of hikes across just seven meetings) or the geopolitical backdrop (one variable that very much carries through to 2023).
Then consider this fundamental oddity: US real GDP growth should only amount to +0.7% this year (Q4/Q4) ... yet, there’s been over 4.5mm new jobs created (payrolls survey) [ZH: with even the Philly Fed confirming our speculation that the BLS is fabricating job numbers it's no longer much of an oddity].
In that context, I’ll borrow a line from Barton Biggs, which I think captures the raw material of what served folks well in 2022:
Although those quantitatively inclined would disagree, to me, investing is much more an art than a science ... experience, diligence, a knowledge of history, an open mind, and an obsessive nature are all important ingredients for the successful [investor] ... as are intuition, imagination, flexibility and maybe just a touch of the seeing eye.
What of 2023?
For the macro crowd, my instinct is these tensions won’t go quietly into the night and the opportunity set will remain decently target rich (e.g. China and Japan could be very actionable theaters).
At the same time, I concede that the broad setup across asset prices today is far less asymmetric than it was at the start of this year.
Therefore, I suspect we’re shifting from a macro environment that favored aggressive trading (see chart below) and brute force (i.e. US 2-year notes surged from 70 bps to 470 bps, that’s about as good as it gets for trend following strategies) to one that is more nuanced, featuring less volatility and more dispersion across markets (which should play to the strengths of RV and equity long/short).
With thanks to Ben Snider in Goldman Research, what follows from here is a check-down of the score board ... I also included the recap on last year at the very bottom of this note, if only for a compare-and-contrast that speaks (quite loudly) for itself.
* * *
The tale of the tape in 2022:
1. The S&P 500 fell by 19%. Including dividends, the total return was -18%. This ranks in the 5th percentile of all annual returns since 1962.
2. Realized volatility was 24%. This ranks in the 92nd historical percentile.
3. Putting those together, the ratio of S&P return-to-vol was -0.7, ranking in the 12th historical percentile.
4. The largest S&P peak-to-trough drawdown during the year was 25%, almost 2x the median historical annual drawdown.
5. The market traded higher on just 43% of days in 2022, the second worst year since WWII (after 1974). This is interesting: the median gain on those days was 115 bps, the highest in postwar history.
6. 31% of S&P stocks posted positive returns, including 66 names up 20% or more and 18 names up 50% or more. On the other side, 188 stocks closed down more than 20% and 26 names were down 50% or more.
7. NDX returned -32%, lagging S&P by 14 percentage points and registering the worst year of underperformance since 2002.
8. US Treasury 10-year notes returned -16%, the worst return on record.
9. Only two of the GICS level one sectors generated positive returns: energy +65%, utilities +2%.
10. The worst sectors: communication services -40%, consumer discretionary -37%, information technology -28%.
11. The best global markets (in local FX): Venezuela +254%, Turkey +207%, Argentina +142%.
12. The worst: Russia -37%, South Korea -24%, China A-shares -20%.
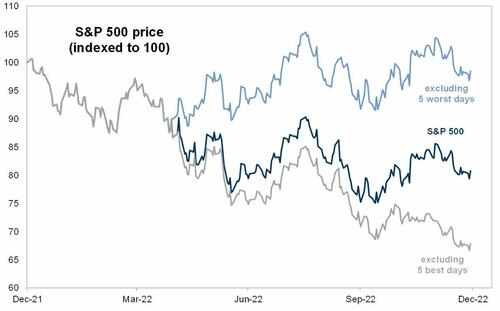
13. Finally, I’ll conclude with a chart, from Ryan Hammond in GIR: as mentioned before, you have probably seen work suggesting that one should not try to time the markets, as missing the best days is a serious drag on returns. While that rang true again (see the gray line), for the world's best traders, note how dodging the worst days this year generated an immense amount of alpha (see the light blue line):
More in the full Pasquariello note available to pro subs.
By Tony Pasquariello, Goldman head of hedge fund sales
For only the third time since 1926, both US stocks and bonds lost money in 2022 (the other two occurrences were 1931 and 1969).
The intra-year path was extraordinary — be it the high print on inflation (I wonder when we’ll see a 9.1% headline on CPI again), the Fed’s response (425 bps of hikes across just seven meetings) or the geopolitical backdrop (one variable that very much carries through to 2023).
Then consider this fundamental oddity: US real GDP growth should only amount to +0.7% this year (Q4/Q4) … yet, there’s been over 4.5mm new jobs created (payrolls survey) [ZH: with even the Philly Fed confirming our speculation that the BLS is fabricating job numbers it’s no longer much of an oddity].
In that context, I’ll borrow a line from Barton Biggs, which I think captures the raw material of what served folks well in 2022:
Although those quantitatively inclined would disagree, to me, investing is much more an art than a science … experience, diligence, a knowledge of history, an open mind, and an obsessive nature are all important ingredients for the successful [investor] … as are intuition, imagination, flexibility and maybe just a touch of the seeing eye.
What of 2023?
For the macro crowd, my instinct is these tensions won’t go quietly into the night and the opportunity set will remain decently target rich (e.g. China and Japan could be very actionable theaters).
At the same time, I concede that the broad setup across asset prices today is far less asymmetric than it was at the start of this year.
Therefore, I suspect we’re shifting from a macro environment that favored aggressive trading (see chart below) and brute force (i.e. US 2-year notes surged from 70 bps to 470 bps, that’s about as good as it gets for trend following strategies) to one that is more nuanced, featuring less volatility and more dispersion across markets (which should play to the strengths of RV and equity long/short).
With thanks to Ben Snider in Goldman Research, what follows from here is a check-down of the score board … I also included the recap on last year at the very bottom of this note, if only for a compare-and-contrast that speaks (quite loudly) for itself.
* * *
The tale of the tape in 2022:
1. The S&P 500 fell by 19%. Including dividends, the total return was -18%. This ranks in the 5th percentile of all annual returns since 1962.
2. Realized volatility was 24%. This ranks in the 92nd historical percentile.
3. Putting those together, the ratio of S&P return-to-vol was -0.7, ranking in the 12th historical percentile.
4. The largest S&P peak-to-trough drawdown during the year was 25%, almost 2x the median historical annual drawdown.
5. The market traded higher on just 43% of days in 2022, the second worst year since WWII (after 1974). This is interesting: the median gain on those days was 115 bps, the highest in postwar history.
6. 31% of S&P stocks posted positive returns, including 66 names up 20% or more and 18 names up 50% or more. On the other side, 188 stocks closed down more than 20% and 26 names were down 50% or more.
7. NDX returned -32%, lagging S&P by 14 percentage points and registering the worst year of underperformance since 2002.
8. US Treasury 10-year notes returned -16%, the worst return on record.
9. Only two of the GICS level one sectors generated positive returns: energy +65%, utilities +2%.
10. The worst sectors: communication services -40%, consumer discretionary -37%, information technology -28%.
11. The best global markets (in local FX): Venezuela +254%, Turkey +207%, Argentina +142%.
12. The worst: Russia -37%, South Korea -24%, China A-shares -20%.
13. Finally, I’ll conclude with a chart, from Ryan Hammond in GIR: as mentioned before, you have probably seen work suggesting that one should not try to time the markets, as missing the best days is a serious drag on returns. While that rang true again (see the gray line), for the world’s best traders, note how dodging the worst days this year generated an immense amount of alpha (see the light blue line):
More in the full Pasquariello note available to pro subs.
Loading…


