Over 75 years have passed since the atomic bombing of Hiroshima and more than 12,000 nuclear warheads are still scattered across the world from silos in Montana to isolated corners of European airbases and even to the ocean depths where ballistic missile submarines lurk as a deterrent nearly impossible to detect.
Hiroshima was the first of two atomic bombings in 1945 and it involved a 15-kiloton device while the weapon used in the attack on Nagasaki three days later had a 22 kiloton yield. Modern nuclear warheads are far more powerful with the U.S. Trident missile yielding a 455 kiloton warhead while Russia's SS ICBM has an 800 kiloton yield.
As Statista's Martin Armstrong reports, together, the United States and Russia possess roughly 90 percent of the world's nuclear weapons with a stockpile of over 8,000 between them, according to the Federation of American Scientists. This figure rises to over 11,000 when counting retired but still intact warheads in the queue for dismantlement.
Even though these are awfully high numbers, they still represent a huge reduction on the number of warheads in existence at the height of the Cold War.
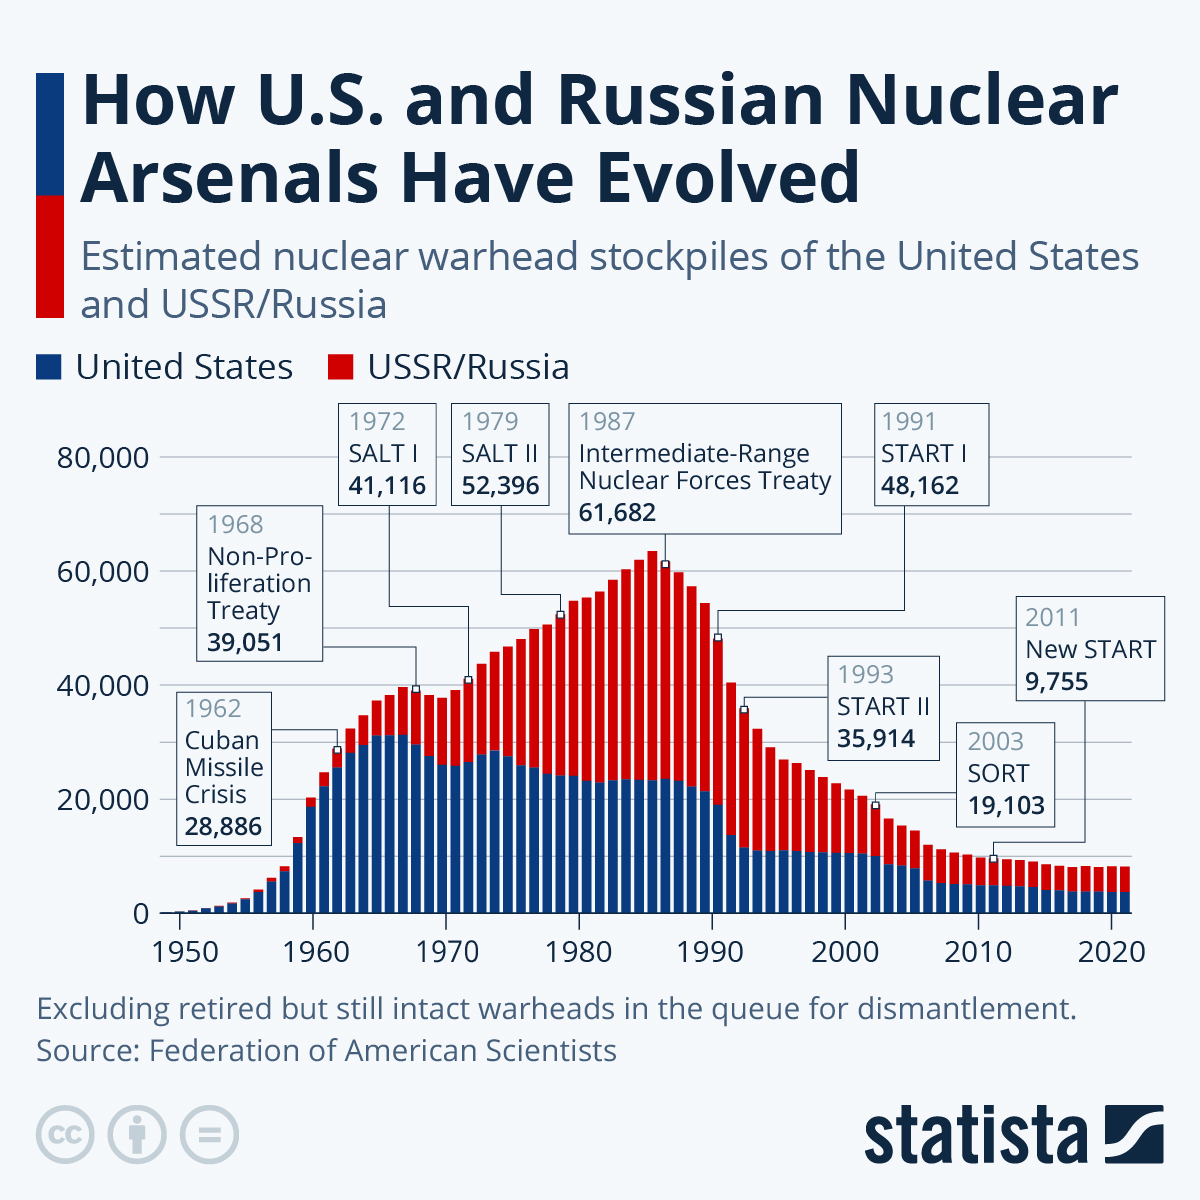
This infographic shows how stockpiles have evolved, particularly when various arms limitation treaties are taken into account.
You will find more infographics at Statista
The number of warheads fell significantly in the wake of the Intermediate-Range Nuclear Forces Treaty which was signed by the U.S. and USSR in 1987 at a time when both countries possessed more than 60,000 nuclear weapons. The trend towards disarmament continued after the Berlin Wall came down and accelerated when the Soviet Union collapsed. The New START Treaty, which came into force in 2011 to restrict the number of warheads deployed by each country from 2018 onwards has helped to keep levels relatively stable in recent years.
Over 75 years have passed since the atomic bombing of Hiroshima and more than 12,000 nuclear warheads are still scattered across the world from silos in Montana to isolated corners of European airbases and even to the ocean depths where ballistic missile submarines lurk as a deterrent nearly impossible to detect.
Hiroshima was the first of two atomic bombings in 1945 and it involved a 15-kiloton device while the weapon used in the attack on Nagasaki three days later had a 22 kiloton yield. Modern nuclear warheads are far more powerful with the U.S. Trident missile yielding a 455 kiloton warhead while Russia’s SS ICBM has an 800 kiloton yield.
As Statista’s Martin Armstrong reports, together, the United States and Russia possess roughly 90 percent of the world’s nuclear weapons with a stockpile of over 8,000 between them, according to the Federation of American Scientists. This figure rises to over 11,000 when counting retired but still intact warheads in the queue for dismantlement.
Even though these are awfully high numbers, they still represent a huge reduction on the number of warheads in existence at the height of the Cold War.
This infographic shows how stockpiles have evolved, particularly when various arms limitation treaties are taken into account.
You will find more infographics at Statista
The number of warheads fell significantly in the wake of the Intermediate-Range Nuclear Forces Treaty which was signed by the U.S. and USSR in 1987 at a time when both countries possessed more than 60,000 nuclear weapons. The trend towards disarmament continued after the Berlin Wall came down and accelerated when the Soviet Union collapsed. The New START Treaty, which came into force in 2011 to restrict the number of warheads deployed by each country from 2018 onwards has helped to keep levels relatively stable in recent years.
Loading…


