May was a volatile month for equity markets, starting off ugly and closing strong, but while most equity indices were able to finish slightly green for the month given the large rally in the final full week of May, the same cannot be said for hedge funds.
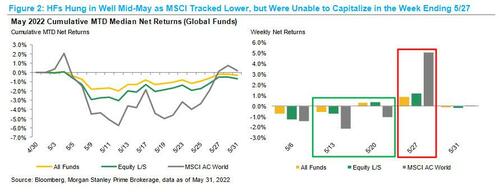
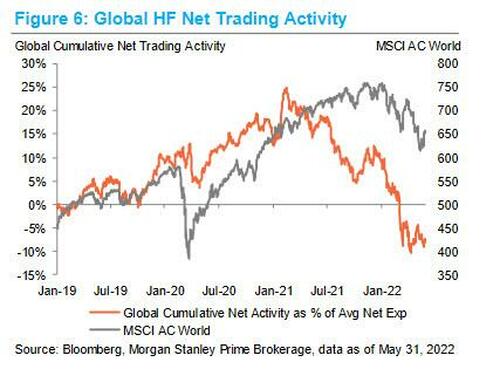
According to the latest weekly report from Morgan Stanley Prime Brokerage (available to pro subscribers), Hedge Funds had felt (and were hammered by) a large portion of the market downside in the first part of May but then hung in well mid-month given most strategies were running lighter net levels at the time. That was as good as it gets however, and HFs then struggled to make back their losses in the final full week of May, capturing only a portion of the rally. This left the average global fund down ~1% for the month.
Digging deeper we find that while the performance of equity markets was quite volatile throughout the month, we did not see nearly the same levels of volatility in HF returns, perhaps due to most strategies running at much lighter net leverage levels (more on HF leverage and positioning below).
According to MS, most of the performance ‘pain’ was felt in the week ending May 6, with HFs posting losses in-line with the MSCI – this also coincided with L/S funds beginning to de-gross. HFs then performed in line with the market for two weeks (weeks ending May 13 & May 20) as HF de-grossing took a pause after May 9, and then HFs returned to adding to gross exposure while keeping nets light.
However, the moderate levels of net leverage then caused HFs to miss out on a large portion of the rally in the week ending May 27 – this lack of upside capture amidst this rally is what ultimately led HFs to lag the index for the month
Goldman's Prime Desk makes a similar conclusion in its May performance post-mortem.
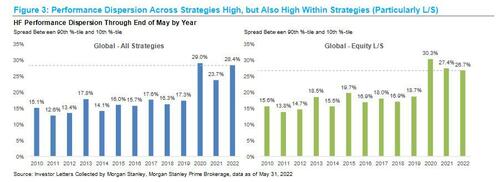
Another notable observation: while performance across all strategies tracked indices relatively well (except for the late month ramp), there is a lot of dispersion both across strategies and intra-strategy through May – the spread between the 90th %-tile and 10th %-tile performers is currently the 2nd widest Morgan Stanley Prime has seen since 2010, trailing only 2020 by a small margin. Among the top performers this year based on investor letters received through April are Systematic Macro (+14.3%), Disc. Macro (+8.3%) and Energy-focused (+4.2%), and while there has been only a small sample of funds who’ve reported for May, these strategies all outperformed the avg. global fund last month. The weaker performers this year have been traditional L/S strategies (-8.4% through May based on our prop estimate), particularly TMT-and HC-focused funds (both down ~14% through Apr based on letters).
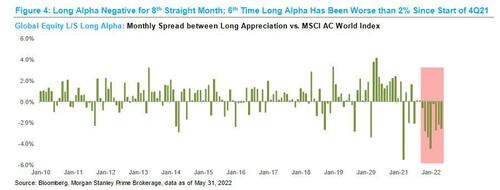
Drilling down into L/S fund performance, global Equity L/S total alpha was negative this past month, all of which was driven by the long side given shorts generated positive alpha of ~1%. Longs held globally by L/S funds fell ~2.4% last month vs. the MSCI ending up +0.2%, representing a negative spread of -2.6%.
Even more embarrassing for the billionaires who make up the 2 and 20 crowd - like Gabe Plotkin - this was the 8th consecutive month where long alpha has been negative, the longest stretch we have seen since we began tracking the data in 2010.
Meanwhile, the spread of -2.6% represented the 6th time in the past 8 months where the spread was lower than -2%. To put this into perspective, for the period from the start of 2010 through the end of 3Q 2021, the spread between longs and the MSCI was worse than -2% only nine times.
Looking at global HF positioning and leverage, MS Prime finds two main themes:
- THEME #1: HFs Continue to Sell Global Equities, Led by US and China
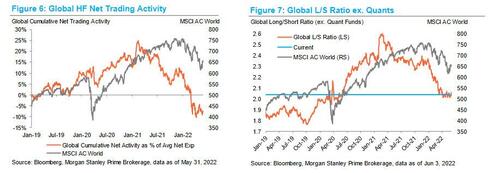
HFs sold global equities for the 6th consecutive month, with the magnitude of the selling in May larger than what we saw in
April, but smaller than March’s flow. The selling can be attributed to Equity L/S (long selling) and Stat Arb/Quant (short adds)
funds, and by region, split between N. America, Asia ex-Japan, and LatAm – HFs were, however, net buyers of both Europe
and Japan.
The Global L/S ratio (ex. Quants) ended just above 2.0x at the end of May, right around where it ended in Apr. At its low, the ratio fell all the way to 2.01x but has yet to break below the 2.0x barrier – the last time it did so was in April of 2020.
- THEME #2: L/S Funds Trim Gross Exp; Gross Lev Now Light Across Most Major Strategies
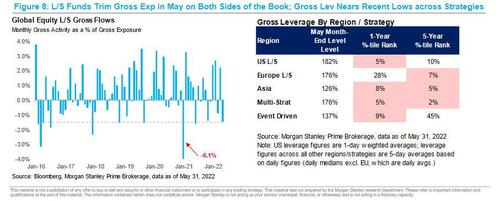
More important even than dismal performance, May ended up being one the largest month in terms of active gross reductions Morgan Stanley Prime has seen YTD by L/S funds, with most of the gross exposure trimmed specifically within the US and China. While this month was far from the most extreme seen in recent years (Jan ’21 was ~4x larger), it is still a notable break in trend from the gross adds that occurred in April. US L/S gross leverage reached a ~2-year low of ~175% intra-month before recovering to 182% by month-end – in addition to US L/S gross lev, gross across many of the major strategies also hit a 12M low in May and remains in the <10th %-tile both over the last 12M and the last 5 years as of last week.
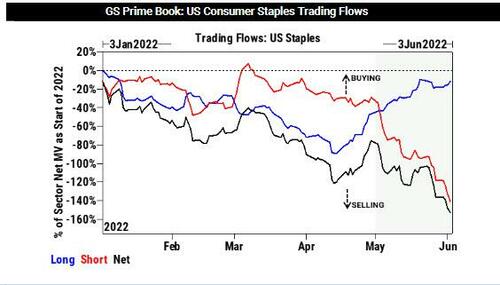
Goldman's Prime Desk makes another interesting observation, which is apropos in light of today's 2nd consecutive guidance cut by Target. According to GS, following challenging earnings results from various companies, Consumer Staples is one of the most net sold sectors in the US, driven entirely by short sales, with short sales outpacing long buys by nearly 5:1. Selling was consistent over the past week as the sector experienced net selling (and short selling) every day over the past week. All industry groups were net sold for the week, with the exception of Food & Staples Retailing, which was marginally net bought. Food Products and Beverages accounted for a large proportion of the net selling flow for the overall sector. Amid this shorting frenzy it is not surprising that relatively within the US, Consumer Staples was one of the worst performing sectors on a five-day basis.
There is much more in the full Morgan Stanley and Goldman Sachs notes, including much more granular detail and in depth analysis of nascent hedge fund themes, with both available to professional subs in the usual place.
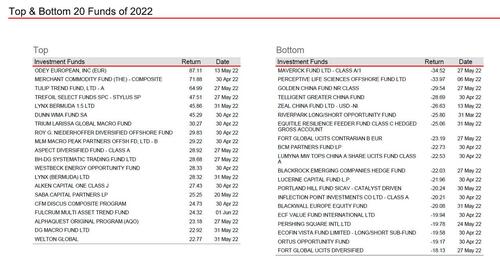
One final observation: courtesy of the latest HSBC hedge fund weekly report (also available to pro subs) here are the best and worst performing hedge funds of 2022:
May was a volatile month for equity markets, starting off ugly and closing strong, but while most equity indices were able to finish slightly green for the month given the large rally in the final full week of May, the same cannot be said for hedge funds.
According to the latest weekly report from Morgan Stanley Prime Brokerage (available to pro subscribers), Hedge Funds had felt (and were hammered by) a large portion of the market downside in the first part of May but then hung in well mid-month given most strategies were running lighter net levels at the time. That was as good as it gets however, and HFs then struggled to make back their losses in the final full week of May, capturing only a portion of the rally. This left the average global fund down ~1% for the month.
Digging deeper we find that while the performance of equity markets was quite volatile throughout the month, we did not see nearly the same levels of volatility in HF returns, perhaps due to most strategies running at much lighter net leverage levels (more on HF leverage and positioning below).
According to MS, most of the performance ‘pain’ was felt in the week ending May 6, with HFs posting losses in-line with the MSCI – this also coincided with L/S funds beginning to de-gross. HFs then performed in line with the market for two weeks (weeks ending May 13 & May 20) as HF de-grossing took a pause after May 9, and then HFs returned to adding to gross exposure while keeping nets light.
However, the moderate levels of net leverage then caused HFs to miss out on a large portion of the rally in the week ending May 27 – this lack of upside capture amidst this rally is what ultimately led HFs to lag the index for the month
Goldman’s Prime Desk makes a similar conclusion in its May performance post-mortem.
Another notable observation: while performance across all strategies tracked indices relatively well (except for the late month ramp), there is a lot of dispersion both across strategies and intra-strategy through May – the spread between the 90th %-tile and 10th %-tile performers is currently the 2nd widest Morgan Stanley Prime has seen since 2010, trailing only 2020 by a small margin. Among the top performers this year based on investor letters received through April are Systematic Macro (+14.3%), Disc. Macro (+8.3%) and Energy-focused (+4.2%), and while there has been only a small sample of funds who’ve reported for May, these strategies all outperformed the avg. global fund last month. The weaker performers this year have been traditional L/S strategies (-8.4% through May based on our prop estimate), particularly TMT-and HC-focused funds (both down ~14% through Apr based on letters).
Drilling down into L/S fund performance, global Equity L/S total alpha was negative this past month, all of which was driven by the long side given shorts generated positive alpha of ~1%. Longs held globally by L/S funds fell ~2.4% last month vs. the MSCI ending up +0.2%, representing a negative spread of -2.6%.
Even more embarrassing for the billionaires who make up the 2 and 20 crowd – like Gabe Plotkin – this was the 8th consecutive month where long alpha has been negative, the longest stretch we have seen since we began tracking the data in 2010.
Meanwhile, the spread of -2.6% represented the 6th time in the past 8 months where the spread was lower than -2%. To put this into perspective, for the period from the start of 2010 through the end of 3Q 2021, the spread between longs and the MSCI was worse than -2% only nine times.
Looking at global HF positioning and leverage, MS Prime finds two main themes:
- THEME #1: HFs Continue to Sell Global Equities, Led by US and China
HFs sold global equities for the 6th consecutive month, with the magnitude of the selling in May larger than what we saw in
April, but smaller than March’s flow. The selling can be attributed to Equity L/S (long selling) and Stat Arb/Quant (short adds)
funds, and by region, split between N. America, Asia ex-Japan, and LatAm – HFs were, however, net buyers of both Europe
and Japan.
The Global L/S ratio (ex. Quants) ended just above 2.0x at the end of May, right around where it ended in Apr. At its low, the ratio fell all the way to 2.01x but has yet to break below the 2.0x barrier – the last time it did so was in April of 2020.
- THEME #2: L/S Funds Trim Gross Exp; Gross Lev Now Light Across Most Major Strategies
More important even than dismal performance, May ended up being one the largest month in terms of active gross reductions Morgan Stanley Prime has seen YTD by L/S funds, with most of the gross exposure trimmed specifically within the US and China. While this month was far from the most extreme seen in recent years (Jan ’21 was ~4x larger), it is still a notable break in trend from the gross adds that occurred in April. US L/S gross leverage reached a ~2-year low of ~175% intra-month before recovering to 182% by month-end – in addition to US L/S gross lev, gross across many of the major strategies also hit a 12M low in May and remains in the <10th %-tile both over the last 12M and the last 5 years as of last week.
Goldman’s Prime Desk makes another interesting observation, which is apropos in light of today’s 2nd consecutive guidance cut by Target. According to GS, following challenging earnings results from various companies, Consumer Staples is one of the most net sold sectors in the US, driven entirely by short sales, with short sales outpacing long buys by nearly 5:1. Selling was consistent over the past week as the sector experienced net selling (and short selling) every day over the past week. All industry groups were net sold for the week, with the exception of Food & Staples Retailing, which was marginally net bought. Food Products and Beverages accounted for a large proportion of the net selling flow for the overall sector. Amid this shorting frenzy it is not surprising that relatively within the US, Consumer Staples was one of the worst performing sectors on a five-day basis.
There is much more in the full Morgan Stanley and Goldman Sachs notes, including much more granular detail and in depth analysis of nascent hedge fund themes, with both available to professional subs in the usual place.
One final observation: courtesy of the latest HSBC hedge fund weekly report (also available to pro subs) here are the best and worst performing hedge funds of 2022:
