Authored by Simon White, Bloomberg macro strategist,
A rise in bankruptcy filings points to increasing bankruptcies, loan charge-off rates and delinquencies, suggesting credit spreads are not reflective of the underlying credit backdrop.
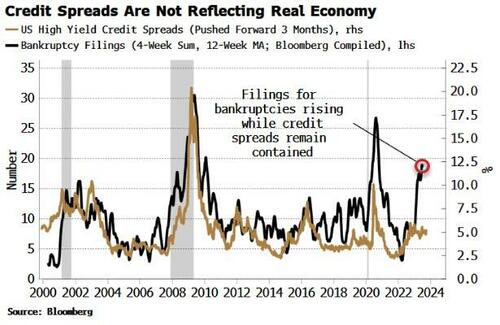
A chart of bankruptcy filings (using weekly data from Bloomberg’s BCY function) and credit spreads I used in last Thursday’s MacroScope column generated a lot of reader interest. This chart, below, shows that filings for bankruptcies have risen sharply despite credit spreads idling for most of this year. Previous rapid rises in filings have been preceded by a widening in credit spreads.
As some readers suggested, perhaps credit spreads are more reflective of what’s actually happening in markets, and the flare in bankruptcy filings is a false flag?
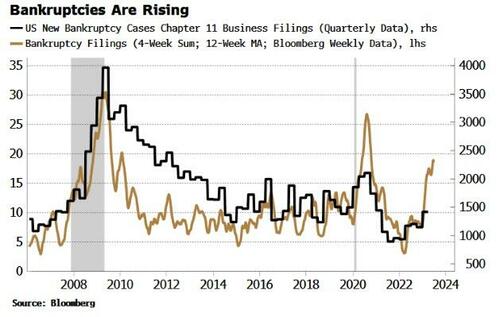
However, it does look like credit spreads might be the outlier. The bankruptcy filings compiled from Bloomberg data is weekly, while Chapter 11 data is quarterly and lagging. As the chart below shows, the weekly data leads the official Chapter 11 series.
Also note bankruptcies themselves lag the business cycle, with the peak seen at the end of the recession. (Shown in the chart above for 2008, and 2020, but less so for the latter when extraordinary measures were taken to limit bankruptcies in the pandemic. Chapter 11 filings heavily lagged in the 2001 recession, not peaking until 2003/04.)
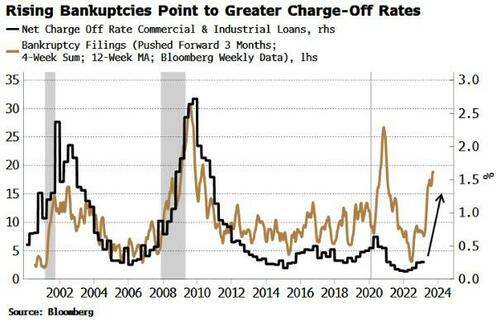
Bankruptcy filings also lead bank loan charge-off rates. The rise in filings points to the increase in charge-off rates gathering pace. Moreover, filings lead loan delinquencies.
It looks like the credit environment is set to worsen, but spreads appear to be nonchalant. Their lack of reaction so far may be due to repressed equity volatility. If so, any potholes in the equity market could lead to a rapid repricing of spreads to match the weakening underlying credit picture.
Loading…


