Authored by Simon White, Bloomberg macro strategist,
Inflation’s current fall is set to wrong-foot investors as its entrenched nature leads to a re-acceleration in price growth and a secular rise in long-term yields.
It’s not over yet. While headline CPI in the US continues to fall from recent highs, the genie is out of the bottle, and underlying structural drivers threaten to re-elevate inflation after the current bout of disinflation peters out.
Bonds are short-term oversold, but longer-term yields are prone to a structural rise as bondholders demand extra compensation for price growth that has become embedded.
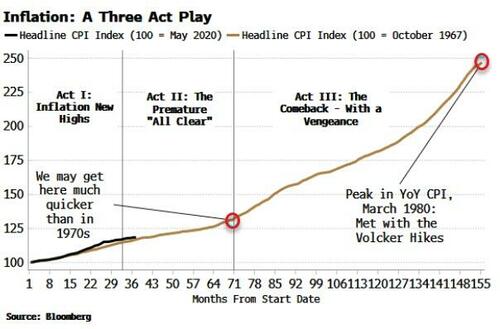
Inflation can be thought of as a play in three acts. The 1970s are considered an imperfect analogy for today, but it in fact captures much of the essence of inflationary episodes.
In that period, we had the initial burst of inflation due to overly loose fiscal and monetary policy in the late 1960s. Then there were rate rises and a recession leading to a fall inflation, and a premature belief the worst was over. This was followed by a resurgence in CPI in the mid-1970s, ultimately requiring the Volcker rate sledgehammer to pacify it.
As the chart below shows, Act II in the 1970s lasted about three years.
Today, however, that time period could be considerably compressed - with inflation beginning to rise again in as little as six months - due to three reasons:
-
Very limited spare capacity in the labor market
-
Persistence in elevated profit margins, leading to a profit-price-wage spiral
-
Stimulus in China provoking a re-acceleration in global and US inflation
Act III in the inflation play will lead to an aversion to longer-duration assets and a structural rise in longer-term yields as term premium prices higher.
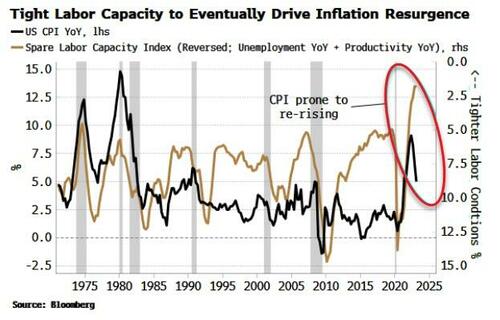
Despite 500 bps of rate hikes since last year, the unemployment rate remains near its historical lows. Productivity is depressed too. Together that means spare labor capacity in the US is as low as it’s been for at least 50 years. As the chart below shows, this likely limits how far inflation can fall before labor-market tightness rekindles it.
When this happens depends on where the inflection point is on the Phillips curve (unemployment versus inflation). The notion of a linear Phillips curve is long gone, with reams of research showing a non-linear relationship between prices and joblessness (e.g. here and here).
Today we are on the steep part of the curve, where inflation can fall without leading to a rise in unemployment. But if inflation does not fall far enough to get us to the inflection point - and the flat part of the curve, where unemployment starts to rise while inflation is steady - then it is poised to increase again due to the underlying tight labor-market conditions.
This is what we saw in the mid-1970s. After the initial drop in inflation, CPI soon returned to levels that were consistent with the rising trend in wages and the falling trend in productivity, both of which are present today.
One of the main reasons why the 1970s are not seen as a fit for the present is the considerably lower level of worker unionization. That was the inflation vector that led to the wage-price spiral. But in the current cycle, profits show increasing signs of performing that role, feeding a profit-price-wage spiral.
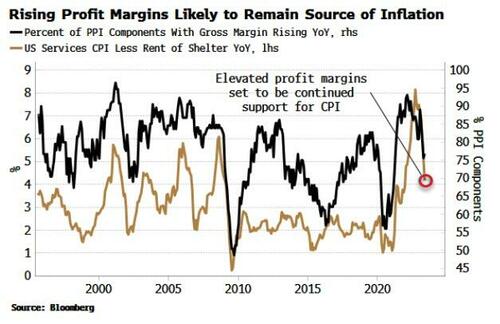
There are several ways of looking at profit margins, but all of them show a marked increase since the pandemic. The US PPI report estimates the margins of sectors across the economy. As the chart below shows, the percentage of sectors with rising margins on an annual basis has fallen from its peak but remains elevated, and this is consistent with inflation remaining supported.
Profit margins could of course fall all the way back to their pre-pandemic levels, but it’s unlikely. As a recent article from the Institute for New Economic Thinking highlights, when the initial cost-push shock is large (as the commodity rise was in 2020/21), it can lead to persistent price rises, as prices across sectors adjust to the input-cost increase at different times.
Companies are constantly trying to catch up with price increases from other companies.
What might be the catalyst for profit and wage-led inflation to be revived? A prime candidate is China. It is the core driver of global inflation, and its halting recovery is one of the main reasons the disinflation in the US and the rest of the world has been so steady.
CPI is barely above zero in China, while PPI is deflationary. This is not something policy makers in China can tolerate indefinitely as growth stagnates and youth unemployment tops 20%.
China will continue to incrementally ease fiscal and monetary policy, and PPI will soon begin rising again, in as little as six months.
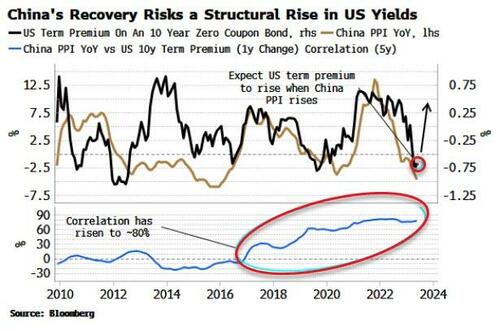
The chart below shows that China’s PPI has become closely correlated with US term premium in recent years, and therefore a rise in PPI threatens to lead to structurally higher longer-term US bond yields as global inflation risks rise.
A realization the inflation play is not over - merely getting ready for the next act - will leave high-duration assets looking ever more exposed, and real assets looking underpriced.
Authored by Simon White, Bloomberg macro strategist,
Inflation’s current fall is set to wrong-foot investors as its entrenched nature leads to a re-acceleration in price growth and a secular rise in long-term yields.
It’s not over yet. While headline CPI in the US continues to fall from recent highs, the genie is out of the bottle, and underlying structural drivers threaten to re-elevate inflation after the current bout of disinflation peters out.
Bonds are short-term oversold, but longer-term yields are prone to a structural rise as bondholders demand extra compensation for price growth that has become embedded.
Inflation can be thought of as a play in three acts. The 1970s are considered an imperfect analogy for today, but it in fact captures much of the essence of inflationary episodes.
In that period, we had the initial burst of inflation due to overly loose fiscal and monetary policy in the late 1960s. Then there were rate rises and a recession leading to a fall inflation, and a premature belief the worst was over. This was followed by a resurgence in CPI in the mid-1970s, ultimately requiring the Volcker rate sledgehammer to pacify it.
As the chart below shows, Act II in the 1970s lasted about three years.
Today, however, that time period could be considerably compressed – with inflation beginning to rise again in as little as six months – due to three reasons:
-
Very limited spare capacity in the labor market
-
Persistence in elevated profit margins, leading to a profit-price-wage spiral
-
Stimulus in China provoking a re-acceleration in global and US inflation
Act III in the inflation play will lead to an aversion to longer-duration assets and a structural rise in longer-term yields as term premium prices higher.
Despite 500 bps of rate hikes since last year, the unemployment rate remains near its historical lows. Productivity is depressed too. Together that means spare labor capacity in the US is as low as it’s been for at least 50 years. As the chart below shows, this likely limits how far inflation can fall before labor-market tightness rekindles it.
When this happens depends on where the inflection point is on the Phillips curve (unemployment versus inflation). The notion of a linear Phillips curve is long gone, with reams of research showing a non-linear relationship between prices and joblessness (e.g. here and here).
Today we are on the steep part of the curve, where inflation can fall without leading to a rise in unemployment. But if inflation does not fall far enough to get us to the inflection point – and the flat part of the curve, where unemployment starts to rise while inflation is steady – then it is poised to increase again due to the underlying tight labor-market conditions.
This is what we saw in the mid-1970s. After the initial drop in inflation, CPI soon returned to levels that were consistent with the rising trend in wages and the falling trend in productivity, both of which are present today.
One of the main reasons why the 1970s are not seen as a fit for the present is the considerably lower level of worker unionization. That was the inflation vector that led to the wage-price spiral. But in the current cycle, profits show increasing signs of performing that role, feeding a profit-price-wage spiral.
There are several ways of looking at profit margins, but all of them show a marked increase since the pandemic. The US PPI report estimates the margins of sectors across the economy. As the chart below shows, the percentage of sectors with rising margins on an annual basis has fallen from its peak but remains elevated, and this is consistent with inflation remaining supported.
Profit margins could of course fall all the way back to their pre-pandemic levels, but it’s unlikely. As a recent article from the Institute for New Economic Thinking highlights, when the initial cost-push shock is large (as the commodity rise was in 2020/21), it can lead to persistent price rises, as prices across sectors adjust to the input-cost increase at different times.
Companies are constantly trying to catch up with price increases from other companies.
What might be the catalyst for profit and wage-led inflation to be revived? A prime candidate is China. It is the core driver of global inflation, and its halting recovery is one of the main reasons the disinflation in the US and the rest of the world has been so steady.
CPI is barely above zero in China, while PPI is deflationary. This is not something policy makers in China can tolerate indefinitely as growth stagnates and youth unemployment tops 20%.
China will continue to incrementally ease fiscal and monetary policy, and PPI will soon begin rising again, in as little as six months.
The chart below shows that China’s PPI has become closely correlated with US term premium in recent years, and therefore a rise in PPI threatens to lead to structurally higher longer-term US bond yields as global inflation risks rise.
A realization the inflation play is not over – merely getting ready for the next act – will leave high-duration assets looking ever more exposed, and real assets looking underpriced.
Loading…


