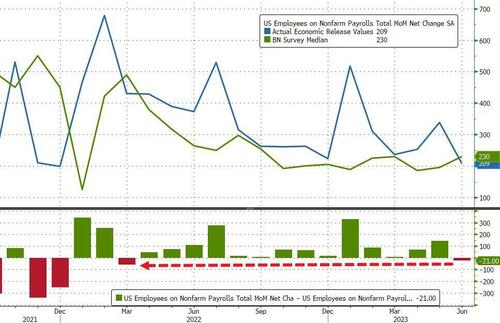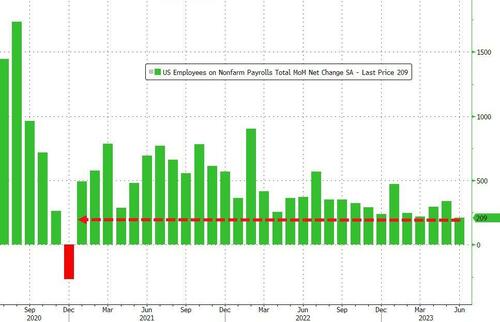
After yesterday's blowout ADP report, according to which almost half a million Americans magically found jobs, moments ago the BLS poured cold water on expectations for a confirmation of the surge in the latest jobs report, when the June payrolls number came in at a measly 209K, a big drop from last month's blowout 339K print which, of course, was revised down to 306K, and the lowest print since Dec 2020.
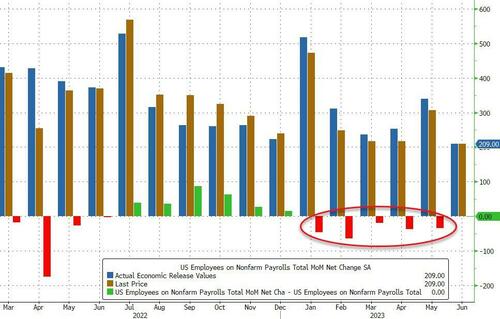
The number missed the median economist expectation of 230K, which was the first time the series has missed since April 2022, and followed 13 consecutive beats.
It wasn't just May that was revised - of course- lower: the change in total nonfarm payroll employment for April was revised down by 77,000, from +294,000 to +217,000, and the change for May was revised down by 33,000, from +339,000 to +306,000. With these revisions, employment in April and May combined is 110,000 lower than previously reported. In fact, every single month in 2023 has now been revised lower.
Of note, after last month's plunge in the Household Survey employment, in June we saw a bounce back as the index rose by 273,000 in June, reversing much of the 310,000 plunge that contradicted the big gain in payrolls — which are derived from the Establishment survey.
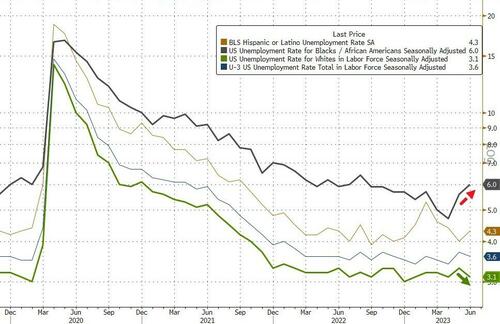
That said, the unemployment rate was unchanged at 3.6%, stronger than expectations of an increase to 3.7%. Among the major worker groups, the unemployment rate for Whites declined to 3.1% in June. Black unemployment rate rose to the highest since Aug 2022; The jobless rates for adult men (3.4 percent), adult women (3.1 percent), teenagers (11.0 percent), Blacks (6.0 percent), Asians (3.2 percent), and Hispanics (4.3 percent) showed little change over the month.
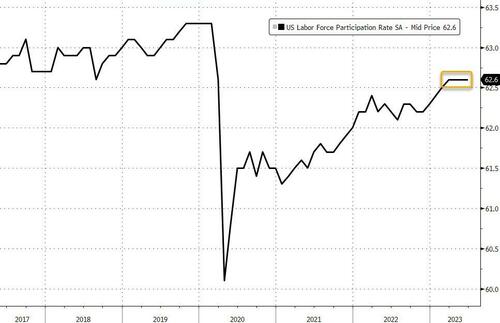
There were no changes in the underemployment rate, which came in at 62.6%, as expected.
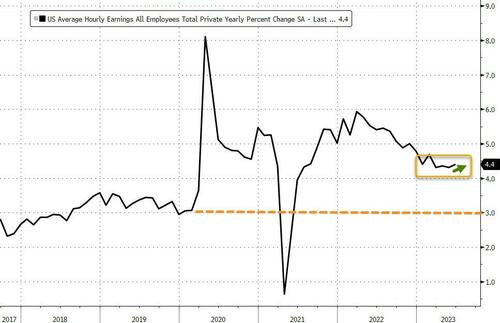
And with the unemployment rate stubbornly hot, hourly earnings also came in hotter than expected, with average hourly earnings rising 0.4% in June, more than the 0.3% expected, and unchanged from last month's upward revised print. On an annual basis, hourly earnings were also flat, at 4.4%, and also came in hotter than the 4.2% exp.
Specifically, average hourly earnings for all employees on private nonfarm payrolls rose by 12 cents, or 0.4 percent, to $33.58. Over the past 12 months, average hourly earnings have increased by 4.4 percent. In June, average hourly earnings of private-sector production and nonsupervisory employees rose by 11 cents, or 0.4 percent, to $28.83.
There was a welcome change in the average weekly hours, which rose fractionally from 34.3 to 34.4, just above the expected 34.3 print. In manufacturing, the average workweek was unchanged at 40.1 hours, and overtime was unchanged at 3.0 hours. The average workweek for production and nonsupervisory employees on private nonfarm payrolls remained at 33.8 hours.
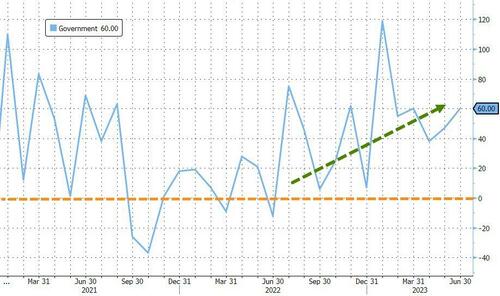
Looking at the composition, we find something bizarre: the biggest contributor to the 209K print was government.
- Employment in government increased by 60,000 in June. Employment continued to trend up in state government (+27,000) and local government (+32,000). Overall, government has added an average of 63,000 jobs per month thus far in 2023, more than twice the average of 23,000 per month in 2022.
- Health care added 41,000 jobs in June. Job growth occurred in hospitals (+15,000), nursing and residential care facilities (+12,000), and home health care services (+9,000). Offices of dentists lost 7,000 jobs.
- Social assistance added 24,000 jobs in June, mostly in individual and family services (+18,000). Job growth in social assistance has averaged 22,000 per month thus far in 2023, in line with the average of 19,000 per month in 2022.
- Employment in construction continued to trend up in June (+23,000). Employment in the industry has increased by an average of 15,000 per month thus far this year, compared with an average of 22,000 per month in 2022. In June, employment in residential specialty trade contractors continued to trend up (+10,000).
- Employment in professional and business services changed little in June (+21,000). Monthly job growth in the industry has averaged 40,000 thus far in 2023, down from 62,000 per month in 2022. Employment in professional, scientific, and technical services continued to trend up over the month (+23,000).
- In June, employment in leisure and hospitality was little changed (+21,000). This marks the third consecutive month of little employment change for this industry.
- Retail trade employment changed little in June (-11,000). Employment continued to decline in building material and garden equipment and supplies dealers (-10,000) and in furniture, home furnishings, electronics, and appliance retailers (-5,000). Motor vehicle and parts dealers added 6,000 jobs.
- Employment in transportation and warehousing changed little in June (-7,000) and has shown no clear trend in recent months. Over the month, employment edged down in couriers and messengers (-7,000) and in warehousing and storage (-7,000), while air transportation added 3,000 jobs.
- Employment showed little or no change over the month in other major industries, including mining, quarrying, and oil and gas extraction; manufacturing; wholesale trade; information; financial activities; and other services.
Overall, while headline payrolls came in weaker than expected, the low unemployment rate and the continued overheating in hourly earnings suggest that the Fed is still on course for a July rate hike. Peter Tchir of Academy Securities agrees:
Weaker than expected jobs data on the headline front, wasn’t supported by some other data in the report:
- Unemployment ticked down to 3.6% as it is based on the Household survey (though, weirdly, the underemployment rate ticked up to 6.9%).
- Hourly earnings came in at 0.4% this month and were revised up to 0.4% last month, keeping the annual rate at 4.4%. Not alarming, but not the direction the Fed would like to see.
- Hours worked ticked up a fraction, to 34.4, which is normally viewed as a positive for the labor market but doesn’t seem to match other parts of these job reports.
- The JOLTS data (which I believe Yellen really looked at closely) declined and is back below 10 million jobs. I highly suspect that this data series is more flawed than most as how jobs are advertised has changed dramatically.
- The BLS Survey Response Rates likely remain low, which creates problems for those trying to interpret the data.
Bottom Line: "A mixed enough report that the Fed can probably go 25 at the next meeting, but we don’t need to price in much more than that."
After yesterday’s blowout ADP report, according to which almost half a million Americans magically found jobs, moments ago the BLS poured cold water on expectations for a confirmation of the surge in the latest jobs report, when the June payrolls number came in at a measly 209K, a big drop from last month’s blowout 339K print which, of course, was revised down to 306K, and the lowest print since Dec 2020.
The number missed the median economist expectation of 230K, which was the first time the series has missed since April 2022, and followed 13 consecutive beats.
It wasn’t just May that was revised – of course- lower: the change in total nonfarm payroll employment for April was revised down by 77,000, from +294,000 to +217,000, and the change for May was revised down by 33,000, from +339,000 to +306,000. With these revisions, employment in April and May combined is 110,000 lower than previously reported. In fact, every single month in 2023 has now been revised lower.
Of note, after last month’s plunge in the Household Survey employment, in June we saw a bounce back as the index rose by 273,000 in June, reversing much of the 310,000 plunge that contradicted the big gain in payrolls — which are derived from the Establishment survey.
That said, the unemployment rate was unchanged at 3.6%, stronger than expectations of an increase to 3.7%. Among the major worker groups, the unemployment rate for Whites declined to 3.1% in June. Black unemployment rate rose to the highest since Aug 2022; The jobless rates for adult men (3.4 percent), adult women (3.1 percent), teenagers (11.0 percent), Blacks (6.0 percent), Asians (3.2 percent), and Hispanics (4.3 percent) showed little change over the month.
There were no changes in the underemployment rate, which came in at 62.6%, as expected.
And with the unemployment rate stubbornly hot, hourly earnings also came in hotter than expected, with average hourly earnings rising 0.4% in June, more than the 0.3% expected, and unchanged from last month’s upward revised print. On an annual basis, hourly earnings were also flat, at 4.4%, and also came in hotter than the 4.2% exp.
Specifically, average hourly earnings for all employees on private nonfarm payrolls rose by 12 cents, or 0.4 percent, to $33.58. Over the past 12 months, average hourly earnings have increased by 4.4 percent. In June, average hourly earnings of private-sector production and nonsupervisory employees rose by 11 cents, or 0.4 percent, to $28.83.
There was a welcome change in the average weekly hours, which rose fractionally from 34.3 to 34.4, just above the expected 34.3 print. In manufacturing, the average workweek was unchanged at 40.1 hours, and overtime was unchanged at 3.0 hours. The average workweek for production and nonsupervisory employees on private nonfarm payrolls remained at 33.8 hours.
Looking at the composition, we find something bizarre: the biggest contributor to the 209K print was government.
- Employment in government increased by 60,000 in June. Employment continued to trend up in state government (+27,000) and local government (+32,000). Overall, government has added an average of 63,000 jobs per month thus far in 2023, more than twice the average of 23,000 per month in 2022.
- Health care added 41,000 jobs in June. Job growth occurred in hospitals (+15,000), nursing and residential care facilities (+12,000), and home health care services (+9,000). Offices of dentists lost 7,000 jobs.
- Social assistance added 24,000 jobs in June, mostly in individual and family services (+18,000). Job growth in social assistance has averaged 22,000 per month thus far in 2023, in line with the average of 19,000 per month in 2022.
- Employment in construction continued to trend up in June (+23,000). Employment in the industry has increased by an average of 15,000 per month thus far this year, compared with an average of 22,000 per month in 2022. In June, employment in residential specialty trade contractors continued to trend up (+10,000).
- Employment in professional and business services changed little in June (+21,000). Monthly job growth in the industry has averaged 40,000 thus far in 2023, down from 62,000 per month in 2022. Employment in professional, scientific, and technical services continued to trend up over the month (+23,000).
- In June, employment in leisure and hospitality was little changed (+21,000). This marks the third consecutive month of little employment change for this industry.
- Retail trade employment changed little in June (-11,000). Employment continued to decline in building material and garden equipment and supplies dealers (-10,000) and in furniture, home furnishings, electronics, and appliance retailers (-5,000). Motor vehicle and parts dealers added 6,000 jobs.
- Employment in transportation and warehousing changed little in June (-7,000) and has shown no clear trend in recent months. Over the month, employment edged down in couriers and messengers (-7,000) and in warehousing and storage (-7,000), while air transportation added 3,000 jobs.
- Employment showed little or no change over the month in other major industries, including mining, quarrying, and oil and gas extraction; manufacturing; wholesale trade; information; financial activities; and other services.
Overall, while headline payrolls came in weaker than expected, the low unemployment rate and the continued overheating in hourly earnings suggest that the Fed is still on course for a July rate hike. Peter Tchir of Academy Securities agrees:
Weaker than expected jobs data on the headline front, wasn’t supported by some other data in the report:
- Unemployment ticked down to 3.6% as it is based on the Household survey (though, weirdly, the underemployment rate ticked up to 6.9%).
- Hourly earnings came in at 0.4% this month and were revised up to 0.4% last month, keeping the annual rate at 4.4%. Not alarming, but not the direction the Fed would like to see.
- Hours worked ticked up a fraction, to 34.4, which is normally viewed as a positive for the labor market but doesn’t seem to match other parts of these job reports.
- The JOLTS data (which I believe Yellen really looked at closely) declined and is back below 10 million jobs. I highly suspect that this data series is more flawed than most as how jobs are advertised has changed dramatically.
- The BLS Survey Response Rates likely remain low, which creates problems for those trying to interpret the data.
Bottom Line: “A mixed enough report that the Fed can probably go 25 at the next meeting, but we don’t need to price in much more than that.”
Loading…
