Heading into today's trading session, Goldman traders John Flood and Michael Nocerino made an interesting observation: while stocks continue to squeeze higher (on hopes the Fed is done destroying the economy, containing the inflation it spawned and generally breaking markets), or slide lower (following every Fed jawbone session vowing to keep hiking the global economy into a depression until Putin somehow unleashes commodity supplies again), inside the market there is a distinct rotation out of tech and into energy.
First, here is Nocerinio (full note available to pro subs in the usual place):
L/O supply on our desk today was noteworthy (ended with a -14% sell skew...highest since 10/10) and it was highly concentrated in defensive HC and super cap tech.... Supply was consistent and methodical. Only noteworthy L/O buy tickets we saw were in higher quality cyclicals (most notably energy... XOM 5th consecutive record high and 11 of the past 12 days). HF buy tickets were covers in lowest quality pockets of the market (China ADRs, Non Profitable Tech, 12M losers etc). Buybacks and CTAs currently prevented drawdown to S&P’s 50dma of 3829 (for now).
And here is Nocerino's recount of Tuesday's desk activity:
Another choppy session following surprising ISM/JOLTS data adding to the skittishness heading into tomorrow’s FOMC print – 75bps all but a lock at this point. Notably, most incomings where in regards to the weakness in MegaCap Tech – our basket (GSTMTMEG) finished bottom of the screens down 3.33% - with a targeted focus on AMZN weakness (-552bps on the day). Here are some thoughts from the desk (ty Bartlett)…”On the high touch desk, we had chunky generalist LO supply here in both AMZN + GOOGL (thematically interesting: AMZN $s are funding energy purchases). Across all desks across floor, the 3 largest sell skews are AMZN, AAPL, and GOOGL. META is the one where we've seen net demand (also the most derisked) into and post the tiktok headlines. To generalize, it feels like mounting frustration w/ the group + generalist pools of capital leaving the space.”
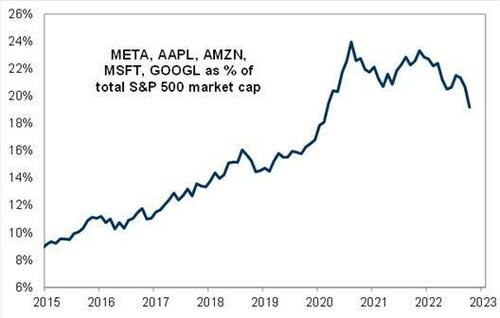
Needless to say, but feels like the 'rotation' out of FAAMG stocks that started last week is continuing today (energy, industrials, fins the beneficiaries). Understandably, the desk is fielding a number of inbounds on the moves lower as relative HF positioning skewed lower into earnings (GS pb data) and valuations are arguably supportive, yet the group trades heavier. On this topic, it feels like 'absolute ownership ( / size)' is playing a role on this recent leg down as these 'FAAMG' stocks still represent ~20% of the S&P500 benchmark (chat below), representing such a large % / part of the investment landscape in US equities (e.g. widely held, even if not crowded)”.
Demonstrating this rotation, here is the rapidly shrinking GAMMA pie: GOOG, AAPL, META, MSFT & AMZN, as a % of total S&P market cap - it is now the lowest since the covid crash.
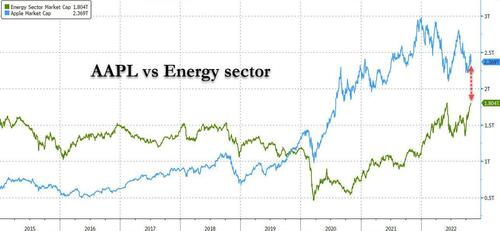
Finally those wondering how much further all this could run, here is a familiar stat: the market cap of AAPL alone remains more than $500 billion higher than the entire energy sector!
Heading into today’s trading session, Goldman traders John Flood and Michael Nocerino made an interesting observation: while stocks continue to squeeze higher (on hopes the Fed is done destroying the economy, containing the inflation it spawned and generally breaking markets), or slide lower (following every Fed jawbone session vowing to keep hiking the global economy into a depression until Putin somehow unleashes commodity supplies again), inside the market there is a distinct rotation out of tech and into energy.
First, here is Nocerinio (full note available to pro subs in the usual place):
L/O supply on our desk today was noteworthy (ended with a -14% sell skew…highest since 10/10) and it was highly concentrated in defensive HC and super cap tech…. Supply was consistent and methodical. Only noteworthy L/O buy tickets we saw were in higher quality cyclicals (most notably energy… XOM 5th consecutive record high and 11 of the past 12 days). HF buy tickets were covers in lowest quality pockets of the market (China ADRs, Non Profitable Tech, 12M losers etc). Buybacks and CTAs currently prevented drawdown to S&P’s 50dma of 3829 (for now).
And here is Nocerino’s recount of Tuesday’s desk activity:
Another choppy session following surprising ISM/JOLTS data adding to the skittishness heading into tomorrow’s FOMC print – 75bps all but a lock at this point. Notably, most incomings where in regards to the weakness in MegaCap Tech – our basket (GSTMTMEG) finished bottom of the screens down 3.33% – with a targeted focus on AMZN weakness (-552bps on the day). Here are some thoughts from the desk (ty Bartlett)…”On the high touch desk, we had chunky generalist LO supply here in both AMZN + GOOGL (thematically interesting: AMZN $s are funding energy purchases). Across all desks across floor, the 3 largest sell skews are AMZN, AAPL, and GOOGL. META is the one where we’ve seen net demand (also the most derisked) into and post the tiktok headlines. To generalize, it feels like mounting frustration w/ the group + generalist pools of capital leaving the space.”
Needless to say, but feels like the ‘rotation’ out of FAAMG stocks that started last week is continuing today (energy, industrials, fins the beneficiaries). Understandably, the desk is fielding a number of inbounds on the moves lower as relative HF positioning skewed lower into earnings (GS pb data) and valuations are arguably supportive, yet the group trades heavier. On this topic, it feels like ‘absolute ownership ( / size)’ is playing a role on this recent leg down as these ‘FAAMG’ stocks still represent ~20% of the S&P500 benchmark (chat below), representing such a large % / part of the investment landscape in US equities (e.g. widely held, even if not crowded)”.
Demonstrating this rotation, here is the rapidly shrinking GAMMA pie: GOOG, AAPL, META, MSFT & AMZN, as a % of total S&P market cap – it is now the lowest since the covid crash.
Finally those wondering how much further all this could run, here is a familiar stat: the market cap of AAPL alone remains more than $500 billion higher than the entire energy sector!


