Authored by Simon White, Bloomberg macro strategist,
The huge outperformance in the stocks of the largest US firms will become further entrenched as they outspend on capex and buybacks, while smaller companies defensively build up cash levels.
Big is beautiful. That’s been the resounding lesson from stock markets over the years. The biggest stocks have not only outperformed the rest, they have made their performance look like a rounding error.
Stock pickers are in a bind as it makes it increasingly unavoidable to own the largest stocks, for fear of missing out on where the bulk of returns are coming from. Unfortunately, it looks like that trend is set to continue as the largest firms fortify their already increasingly unassailable position.
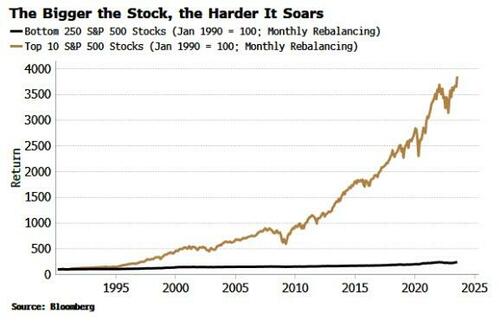
The gulf between the largest and smaller companies can be seen in the chart below. Since 1990, a portfolio of the 10 largest companies in the S&P 500 rebalanced monthly has returned a stupefying 37x versus only 2.3x for the bottom 250 firms in the index.
Some of the stratospheric performance of the large-stock portfolio is due to calendar effects from rebalancing at the start of the month, but the smaller portfolio also benefits from that.
No matter which day of the month we rebalance, the largest stocks greatly outperform.
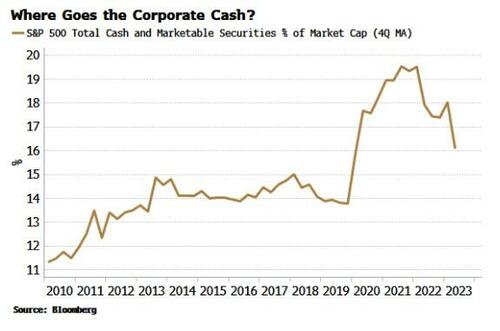
That is unlikely to change and, if anything, is set to extend even further. To see this, we need to look at corporate cash. One key post-pandemic trend has been the running down of firms’ cash levels. As with consumers who built up excess savings in the pandemic, companies built up their cash positions. Now these are falling.
Rising interest rates are not the driver. The net interest expense for the companies in the S&P has fallen marginally over the last two years. One conjecture that’s been put forward is that companies have deployed their excess cash in higher interest-paying accounts and MMFs, and this is mitigating their net interest costs. But that’s not why corporate cash is falling.
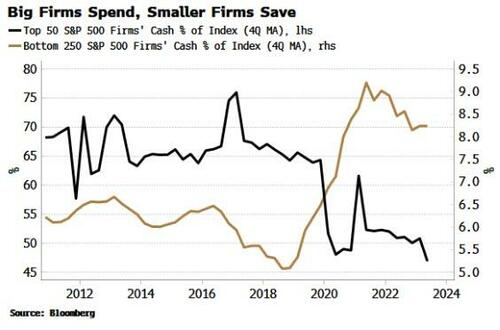
To see why it is, we need to look beyond the simple average. What we find is a significant bifurcation: the largest firms have driven all of the fall in corporate cash for S&P 500 companies. The smallest companies, on the other hand, have been raising their cash levels. (As an aside, note that the top 10% of the firms in the S&P 500 have 50% of the cash).
Perhaps larger firms have been paying out more in dividends? But the median payout ratio of the biggest firms has fallen significantly over the last five years while it has remained static for companies in the bottom half of the S&P.
Instead, the fall in cash of big companies has been driven by rising capex and share buybacks. The 10 largest companies have significantly increased their capex over the last five years, while smaller companies defensively hold on to cash. We can see this most clearly by looking at the median capex of the companies in the mid-cap Russell 2000.
Surging investment in AI accounts for the tech-dominated top-10’s rise in capex. Microsoft, Alphabet et al are investing billions of dollars in new data centers and processing units to increase their capacity to train and run huge AI models. Elon Musk recently remarked that it seems like “everyone and their dog is buying GPUs”.
The only firm in the top ten to buck the trend is Berkshire Hathaway, whose cash levels have risen to a near-record $147 billion. It says something about the dearth of opportunities if a stock picker like Warren Buffett is unwilling to deploy cash into new investments.
Increased investment when smaller companies are standing still only raises the likelihood the largest companies widen their moats even more, leaving other companies to scrap among each other for increasingly meager slivers of market share.
Smaller companies’ disadvantage is being compounded by buybacks. For the largest companies, they have increased sharply in recent years, while for smaller firms they are unchanged. Buybacks reduce the share count and thus increase the EPS, making the stock look more attractive. The deeper and wider moat of the business models of the largest companies is being reinforced by a moat in the share price.
And in a reminder that life is not fair, the free cash flow position relative to debt for the largest companies has improved, despite their falling cash levels and increased spending on capex. For the smallest companies, the FCF-to-debt ratio has been worsening.
The largest firms’ domination creates skewed incentives, forcing managers into fewer and fewer stocks in a bid to post competitive returns and continue to attract inflows.
It’s a safe bet that many of them are not experts in tech.
Where does this all end? Portfolios of the largest stocks see significant drawdowns when assets sell off, so there are material risks. But as long as the fundamental drivers of megacap-outperformance – network effects and outmoded anti-trust legislation – persist, the longer-term ”plutocracy of equities” shows no signs of abating.
Loading…


