Over the last three decades, the growth of tech companies has driven a shift in the ranking of the most valuable companies in the United States.
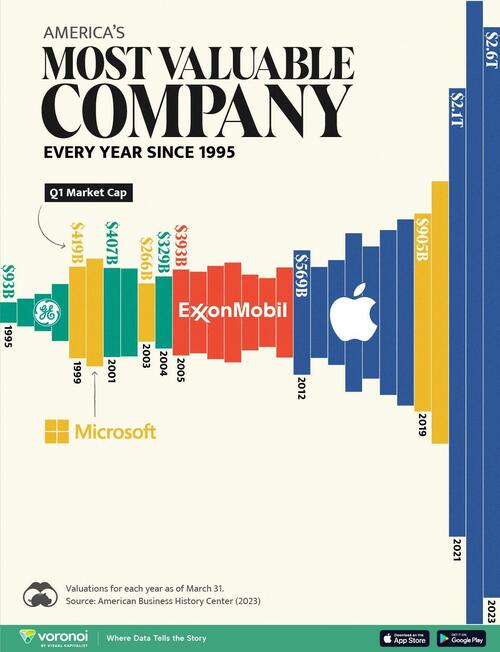
In this graphic, Visual Capitalist's Marcus Lu and Bruno Venditti utilize data from the American Business History Center to present the history of America’s most valuable public company from 1995 to 2023. Valuations are for March 31 of that year, and are not adjusted for inflation.
The Surge of Tech Giants
In the early 1990s, the top rank was dominated by General Electric. The centenary company held a significant presence in the market with its various divisions, encompassing aerospace, power, renewable energy, digital industry, and finance.
In 1999, however, GE was surpassed by Microsoft. In that year, Bill Gates’ company launched its first online store, and Internet Explorer 5.0 was introduced, followed by more than 1 million downloads of the new version in less than a week.
| Year | Company | Market Cap (as of Q1) |
|---|---|---|
| 1995 | General Electric | $93,322 billion |
| 1996 | General Electric | $126,523 billion |
| 1997 | General Electric | $169,388 billion |
| 1998 | General Electric | $260,147 billion |
| 1999 | Microsoft | $418,579 billion |
| 2000 | Microsoft | $492,462 billion |
| 2001 | General Electric | $407,054 billion |
| 2002 | General Electric | $401,499 billion |
| 2003 | Microsoft | $266,037 billion |
| 2004 | General Electric | $329,240 billion |
| 2005 | ExxonMobil | $392,636 billion |
| 2006 | ExxonMobil | $372,792 billion |
| 2007 | ExxonMobil | $425,795 billion |
| 2008 | ExxonMobil | $455,929 billion |
| 2009 | ExxonMobil | $345,815 billion |
| 2010 | ExxonMobil | $314,154 billion |
| 2011 | ExxonMobil | $411,638 billion |
| 2012 | Apple | $568,615 billion |
| 2013 | Apple | $415,683 billion |
| 2014 | Apple | $479,069 billion |
| 2015 | Apple | $724,773 billion |
| 2016 | Apple | $604,304 billion |
| 2017 | Apple | $753,718 billion |
| 2018 | Apple | $851,318 billion |
| 2019 | Microsoft | $904,861 billion |
| 2020 | Microsoft | $1.199 trillion |
| 2021 | Apple | $2.050 trillion |
| 2022 | Apple | $2.849 trillion |
| 2023 | Apple | $2.609 trillion |
Both Microsoft and GE competed for the top spot from 2000 to 2004. However, after 2005, ExxonMobil held the position for seven years. Following the 1998 Exxon and Mobil $74 billion merger agreement, the largest oil company in the world benefited from increasing gas prices over that period.
Since 2012, however, the ranking has been dominated by Apple. Boosted by the success of its iPhone line, its biggest cash cow, the company was only behind Microsoft in 2019 and 2020 when concerns about COVID-driven supply chain shortages affected the iPhone maker’s stock price.
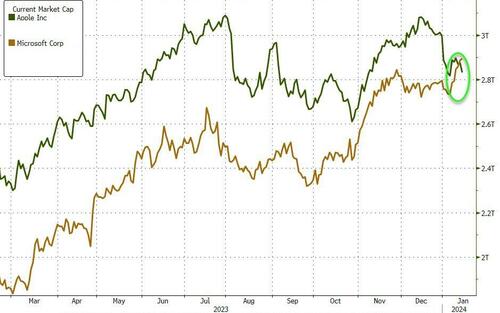
More recently, Microsoft overtook Apple as the world’s most valuable company in January 2024, after the iPhone maker’s shares had a weak start to the year due to growing concerns over demand in China.
Meanwhile, Microsoft’s shares rose sharply thanks to the early lead the company had taken in generative artificial intelligence through an investment in ChatGPT-maker OpenAI.
Over the last three decades, the growth of tech companies has driven a shift in the ranking of the most valuable companies in the United States.
In this graphic, Visual Capitalist’s Marcus Lu and Bruno Venditti utilize data from the American Business History Center to present the history of America’s most valuable public company from 1995 to 2023. Valuations are for March 31 of that year, and are not adjusted for inflation.
The Surge of Tech Giants
In the early 1990s, the top rank was dominated by General Electric. The centenary company held a significant presence in the market with its various divisions, encompassing aerospace, power, renewable energy, digital industry, and finance.
In 1999, however, GE was surpassed by Microsoft. In that year, Bill Gates’ company launched its first online store, and Internet Explorer 5.0 was introduced, followed by more than 1 million downloads of the new version in less than a week.
| Year | Company | Market Cap (as of Q1) |
|---|---|---|
| 1995 | General Electric | $93,322 billion |
| 1996 | General Electric | $126,523 billion |
| 1997 | General Electric | $169,388 billion |
| 1998 | General Electric | $260,147 billion |
| 1999 | Microsoft | $418,579 billion |
| 2000 | Microsoft | $492,462 billion |
| 2001 | General Electric | $407,054 billion |
| 2002 | General Electric | $401,499 billion |
| 2003 | Microsoft | $266,037 billion |
| 2004 | General Electric | $329,240 billion |
| 2005 | ExxonMobil | $392,636 billion |
| 2006 | ExxonMobil | $372,792 billion |
| 2007 | ExxonMobil | $425,795 billion |
| 2008 | ExxonMobil | $455,929 billion |
| 2009 | ExxonMobil | $345,815 billion |
| 2010 | ExxonMobil | $314,154 billion |
| 2011 | ExxonMobil | $411,638 billion |
| 2012 | Apple | $568,615 billion |
| 2013 | Apple | $415,683 billion |
| 2014 | Apple | $479,069 billion |
| 2015 | Apple | $724,773 billion |
| 2016 | Apple | $604,304 billion |
| 2017 | Apple | $753,718 billion |
| 2018 | Apple | $851,318 billion |
| 2019 | Microsoft | $904,861 billion |
| 2020 | Microsoft | $1.199 trillion |
| 2021 | Apple | $2.050 trillion |
| 2022 | Apple | $2.849 trillion |
| 2023 | Apple | $2.609 trillion |
Both Microsoft and GE competed for the top spot from 2000 to 2004. However, after 2005, ExxonMobil held the position for seven years. Following the 1998 Exxon and Mobil $74 billion merger agreement, the largest oil company in the world benefited from increasing gas prices over that period.
Since 2012, however, the ranking has been dominated by Apple. Boosted by the success of its iPhone line, its biggest cash cow, the company was only behind Microsoft in 2019 and 2020 when concerns about COVID-driven supply chain shortages affected the iPhone maker’s stock price.
More recently, Microsoft overtook Apple as the world’s most valuable company in January 2024, after the iPhone maker’s shares had a weak start to the year due to growing concerns over demand in China.
Meanwhile, Microsoft’s shares rose sharply thanks to the early lead the company had taken in generative artificial intelligence through an investment in ChatGPT-maker OpenAI.
Loading…


