As we noted earlier Monday, House Speaker Kevin McCarthy is trying to pull a rabbit out of a hat (or something out of something), as he scrambles to avoid the fourth potential government shutdown in a decade before an anticipated September 1st drop-dead date.
Any House bill would still need to be reconciled with a Senate bill that would likely raise spending levels.
In the event McCarthy can't convince Freedom Caucus House Republicans to agree to a short-term 30-day continuing resolution (CR) to fund the government at last year's levels into the fall, Society Generale's head of US Rates Strategy, Subadra Rajappa, lays out what has happened in previous shutdowns - and what might be in store for investors.
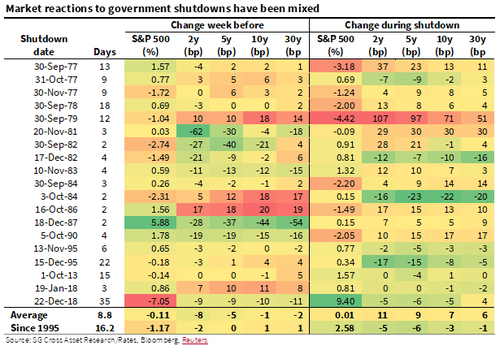
Government shutdowns, while disruptive, have generally been short-lived affairs, averaging just 8.8 days. However, some outliers like those in 1995 and 2018, which extended beyond 20 days, suggest that the current political climate might again facilitate a more prolonged face-off.
So, when the feds turn off the lights - investors historically shuffle into front-end Treasuries as a safe haven, while yields and stocks tend to seesaw - guided by investors' anticipation of a deal. The front-end and belly of the US Treasury curve generally outperform the long end, providing some directional cues for traders. However, the data is not uniformly so, as the Treasury market is more nuanced.
The nature and eventual outcome of the budget negotiations may determine how Treasury bonds react. The moves in the long end of the UST curve have been varied during previous episodes. The 30y yield rose in the week preceding thirteen out of nineteen of the previous shutdowns. Some of the selloff in the long end over the past few months has likely been prompted by increased worries over rising deficits and increased privately-held UST supply.
If a shutdown ends with a deal that significantly reduces future deficits, it could be a positive for the long end. On the other hand, a protracted political fight that does not result in any meaningful budget reform could prompt higher yields, as it would be another sign of gridlock in Washington, particularly in the context of the debt ceiling debacle and Fitch rating downgrade earlier this year. -SocGen
In the run-up to the five government shutdowns since 1995, the 2-year UST yield only rallied by 2 basis points, while the belly and the long end of the curve exhibited some sell-off.
On the long end, perhaps the most intriguing aspect is the divergent movements in the long-end yield. If this shutdown culminates in a deal that significantly trims future deficits, the long end could see a positive bump. But if we're treated to another theatrical episode of Washington gridlock, expect higher yields and increased anxieties about fiscal irresponsibility, especially after the recent Fitch downgrade.
As for stocks, While the S&P 500 typically suffers in the week preceding a shutdown, a different picture emerges during the shutdown itself - with the index averaging a 2.3% uptick since 1995.
This seemingly paradoxical behavior could be linked to a variety of factors, but it seems to align with the safe-haven bid favoring front-end Treasuries.
As we noted earlier Monday, House Speaker Kevin McCarthy is trying to pull a rabbit out of a hat (or something out of something), as he scrambles to avoid the fourth potential government shutdown in a decade before an anticipated September 1st drop-dead date.
Any House bill would still need to be reconciled with a Senate bill that would likely raise spending levels.
In the event McCarthy can’t convince Freedom Caucus House Republicans to agree to a short-term 30-day continuing resolution (CR) to fund the government at last year’s levels into the fall, Society Generale’s head of US Rates Strategy, Subadra Rajappa, lays out what has happened in previous shutdowns – and what might be in store for investors.
Government shutdowns, while disruptive, have generally been short-lived affairs, averaging just 8.8 days. However, some outliers like those in 1995 and 2018, which extended beyond 20 days, suggest that the current political climate might again facilitate a more prolonged face-off.
So, when the feds turn off the lights – investors historically shuffle into front-end Treasuries as a safe haven, while yields and stocks tend to seesaw – guided by investors’ anticipation of a deal. The front-end and belly of the US Treasury curve generally outperform the long end, providing some directional cues for traders. However, the data is not uniformly so, as the Treasury market is more nuanced.
The nature and eventual outcome of the budget negotiations may determine how Treasury bonds react. The moves in the long end of the UST curve have been varied during previous episodes. The 30y yield rose in the week preceding thirteen out of nineteen of the previous shutdowns. Some of the selloff in the long end over the past few months has likely been prompted by increased worries over rising deficits and increased privately-held UST supply.
If a shutdown ends with a deal that significantly reduces future deficits, it could be a positive for the long end. On the other hand, a protracted political fight that does not result in any meaningful budget reform could prompt higher yields, as it would be another sign of gridlock in Washington, particularly in the context of the debt ceiling debacle and Fitch rating downgrade earlier this year. -SocGen
In the run-up to the five government shutdowns since 1995, the 2-year UST yield only rallied by 2 basis points, while the belly and the long end of the curve exhibited some sell-off.
On the long end, perhaps the most intriguing aspect is the divergent movements in the long-end yield. If this shutdown culminates in a deal that significantly trims future deficits, the long end could see a positive bump. But if we’re treated to another theatrical episode of Washington gridlock, expect higher yields and increased anxieties about fiscal irresponsibility, especially after the recent Fitch downgrade.
As for stocks, While the S&P 500 typically suffers in the week preceding a shutdown, a different picture emerges during the shutdown itself – with the index averaging a 2.3% uptick since 1995.
This seemingly paradoxical behavior could be linked to a variety of factors, but it seems to align with the safe-haven bid favoring front-end Treasuries.
Loading…


