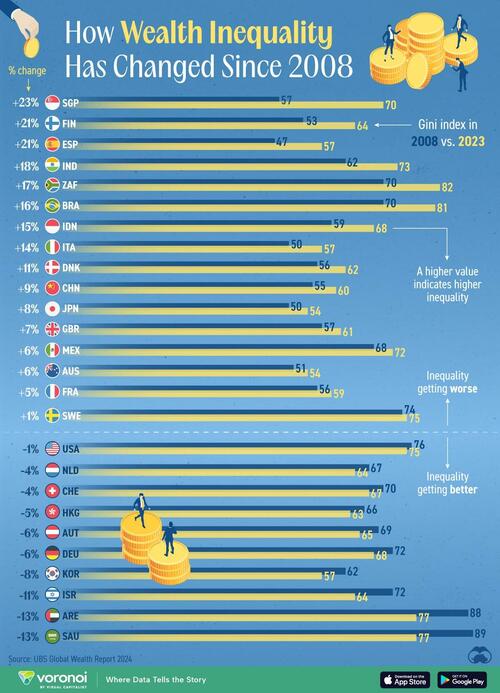
This graphic, via Visual Capitalist's Marcus Lu, tracks wealth inequality changes in various countries as measured by their Gini index values in 2008 to 2023.

Data is accessed via the UBS Global Wealth Report 2024.
ℹ️ The Gini index measures wealth inequality within a population, ranging from 0% (perfect equality) to 100% (maximum inequality).
Higher values indicate greater disparity in wealth distribution. For example, a country where one person owned all the assets and everyone else had nothing would have a Gini index of 100%.
Ranked: Countries by Wealth Disparity Changes (2008–2023)
In UBS’ list of select countries, Singapore has seen the largest growth in its Gini index, up to 70% in 2023 from 53% in 2008.
The government has enacted policies intended to attract high-net-worth individuals as well as international investment capital to Singapore.
On the flip side, policies to reduce inequality have been constructed through an economic lens, such as trying to remove structural barriers that prevent people from maximizing productivity.
Interestingly, in the same time period, Singapore’s average wealth rose by 116%, while median wealth fell by 2%.
Also in the top three, Finland and Spain join Singapore as the three countries who’ve seen a 20 percentage point increase in their Gini index values since 2008. Of the 29 countries analyzed by UBS, 18 registered rising wealth inequality.
However, wealth disparity has also reduced for several countries, some of them large economies: the U.S. (-1%), Germany (-6%), and Saudi Arabia (-13%).
A recent Federal Reserve analysis found that from 2019 to 2022, low-wealth groups in America had larger percentage gains in wealth compared to their high-wealth counterparts.
Check out Visualizing Wealth Inequality by Country (2024) for a comparison of wealth disparity in the world’s biggest economies.
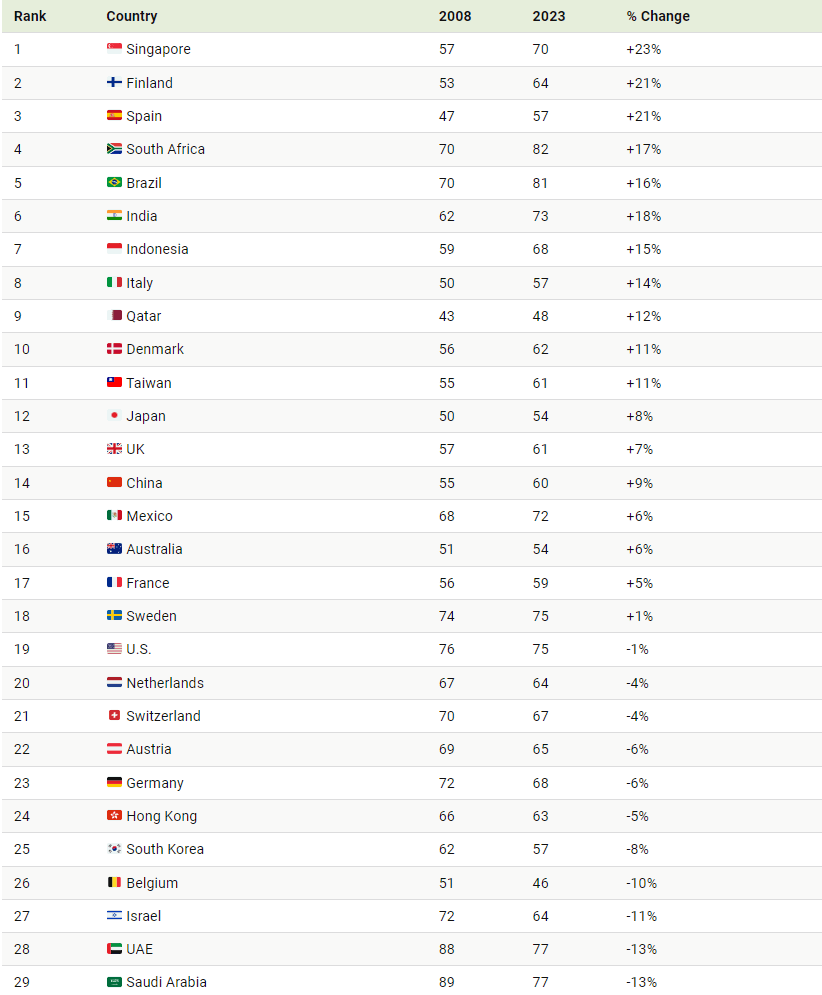
This graphic, via Visual Capitalist’s Marcus Lu, tracks wealth inequality changes in various countries as measured by their Gini index values in 2008 to 2023.

Data is accessed via the UBS Global Wealth Report 2024.
ℹ️ The Gini index measures wealth inequality within a population, ranging from 0% (perfect equality) to 100% (maximum inequality).
Higher values indicate greater disparity in wealth distribution. For example, a country where one person owned all the assets and everyone else had nothing would have a Gini index of 100%.
Ranked: Countries by Wealth Disparity Changes (2008–2023)
In UBS’ list of select countries, Singapore has seen the largest growth in its Gini index, up to 70% in 2023 from 53% in 2008.

The government has enacted policies intended to attract high-net-worth individuals as well as international investment capital to Singapore.
On the flip side, policies to reduce inequality have been constructed through an economic lens, such as trying to remove structural barriers that prevent people from maximizing productivity.
Interestingly, in the same time period, Singapore’s average wealth rose by 116%, while median wealth fell by 2%.
Also in the top three, Finland and Spain join Singapore as the three countries who’ve seen a 20 percentage point increase in their Gini index values since 2008. Of the 29 countries analyzed by UBS, 18 registered rising wealth inequality.
However, wealth disparity has also reduced for several countries, some of them large economies: the U.S. (-1%), Germany (-6%), and Saudi Arabia (-13%).
A recent Federal Reserve analysis found that from 2019 to 2022, low-wealth groups in America had larger percentage gains in wealth compared to their high-wealth counterparts.
Check out Visualizing Wealth Inequality by Country (2024) for a comparison of wealth disparity in the world’s biggest economies.
Loading…