After last month's stunning payrolls report, when in our post-mortem we revealed not only a year full of monthly downward data revisions, but also collapse in tull-time jobs and surge in part-time jobs, as well asalso the worst unadjusted August payrolls since the great recession, we thought that nothing could shock us any more. And then we got the September jobs report.
We won't spend too much time dissecting the report since regular readers are all too aware of the same old "upward goalseeking" tactics used by the BLS, so here are the highlights.
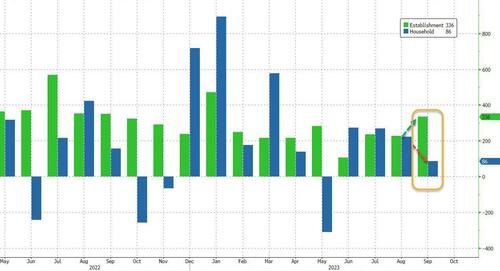
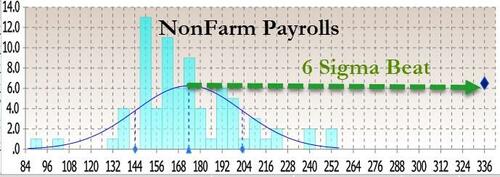
First, the 336K jump in headline payrolls - the biggest since January - was stunning when considering that it was not only above the highest Wall Street estimate but was a 6-sigma beat to expectations.
How is it possible to get such an outlier print to not only trends but expectations? Let's try to answer that question.
If, as the BLS claims, in September the jobs market suddenly reversed a year of declines, surely there will be some qualitative validations to this quantitative outlier, right? Unfortunately, looking through the supporting evidence we don't find any justification to the BLS exuberance.
Let's start with the Household survey: here instead of a number anywhere close to the 336K jobs gained (as the far less accurate Establishment survey reports), the number of newly employed workers was just 86K, the lowest since May, and the second lowest of 2023!
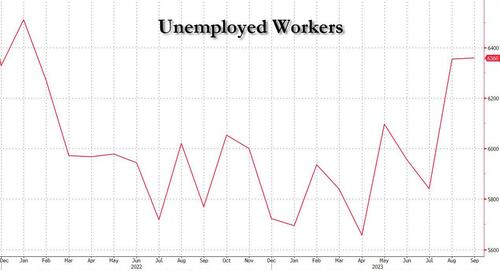
And since the number of unemployed workers also rose to 6.360 million, the highest number since January 2022, the unemployment rate was sticky at 3.8%, and refused to drop to 3.7% as consensus had expected.
How about the Establishment survey? Well, here too, things stink. Yes, the headline surge was great, but the question here is how much of that was purely seasonals.
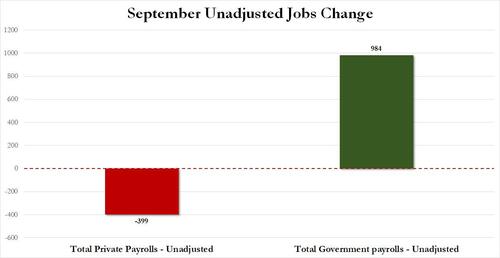
Consider what Vanda Research FX trader Viraj Patel noted earlier: the official adjusted data showed this Leisure and Hospitality added a whopping +96k jobs. But unadjusted data showed that the sector lost 466k jobs in Sep. This means that the unadjusted private sector payrolls was -399!
⚠️ I wonder how much of the payrolls upside is to do with seasonal quirks more than anything. Take Leisure & Hospitality. Official adjusted data shows this add +96k jobs. But unadjusted data shows sector shed 466k jobs in Sep. Unadjusted private sector payrolls was -399k 🤷♂️ $USD pic.twitter.com/ME1VFf4RHp
— Viraj Patel (@VPatelFX) October 6, 2023
Wait, if unadjusted total payrolls rose by 585K and yet private payrolls dropped by 399K, that means that... you got it: in September, all of the unadjusted jobs came from - drumroll - the government, which added a whopping 984K jobs (mostly teachers).
Translation: for yet another month all the strength in the Establishment was thanks to seasonals and various plugs that made the total number much stronger.
And now, let's turn again to the much more detailed and accurate Household Survey, where we find the BLS back to its old tricks again.
First, as we pointed out earlier, despite the alleged quantitative surge, the quality of the jobs was anything but good. In fact, looking at the infamous table A-9 of the employment report, reveals that in September, a seasonally adjusted breakdown of jobs shows that part-time workers accounted for the entire increase, rising by 151K; as for full-time workers? Well, for yet another month, this number dropped, sliding by 22K in September.
Full-time workers: -22K
— zerohedge (@zerohedge) October 6, 2023
Part-time workers: +151K
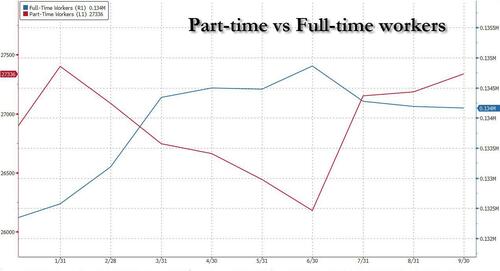
Indeed, as shown in the chart below, while part-time workers rose for the third consecutive month to 27.336 million,and the highest since January, full-time workers have decline for three straight months, and at 134.167 million, this was the lowest number going back to February!
But hold on, you say, why use Seasonally Adjusted number when we already noted above that there continue to be chronic issues with the BLS' seasonal adjustments in the post-covid era. True, so let's use unadjusted numbers instead. What do we get?
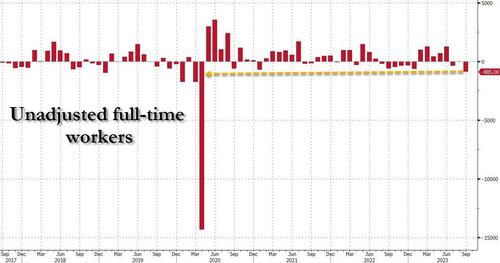
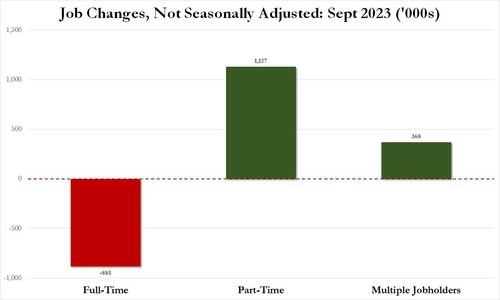
Well, we get the following whopper: in September, the number of unadjusted full-time workers collapsed by 885K. This was the biggest monthly drop since - drumroll- April 2020 when the economy was shut down!
And if full-time workers plunged, that must mean that part-timers exploded, right? Why yes, they did: by 1.127 million in one month to be precise, and at 27.109 million the number of part-time workers was the highest since April.
Finally, let's not forget the number of multiple jobholders: those unlucky souls which have to work not one but two (or more) jobs to make ends meet under Bidenomics. Also, multiple jobholders (which are measured by the Household Survey) are double, and triple- counted when it comes to the Establishment Survey. So how did thy do in September? Well, on a seasonally adjusted basis, the number increased by 123K to 8.151 million, the highest since January 2020. As for the much more accurate, unadjusted number, well that soared from 7.778 million to 8.146 million, an increase of 368K, or more than all the 336K payrolls reported by the establishment survey.
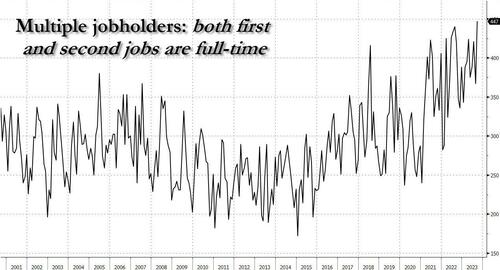
In other words, all of the job gains in September were either from part-time workers or multiple jobholders forced to get another job in addition to their current one, and thus be counted by the BLS as two distinct jobs (or more). One final observation on the multiple jobholders: in September, the subset of multiple jobholders who held both a primary and secondary full-time job just hit an all time high.
Visually, this is what September's "stunning" jobs report really looked like.
Source for everything: BLS, but one needs to do some actual work to get a sense of what is really going on.
After last month’s stunning payrolls report, when in our post-mortem we revealed not only a year full of monthly downward data revisions, but also collapse in tull-time jobs and surge in part-time jobs, as well asalso the worst unadjusted August payrolls since the great recession, we thought that nothing could shock us any more. And then we got the September jobs report.
We won’t spend too much time dissecting the report since regular readers are all too aware of the same old “upward goalseeking” tactics used by the BLS, so here are the highlights.
First, the 336K jump in headline payrolls – the biggest since January – was stunning when considering that it was not only above the highest Wall Street estimate but was a 6-sigma beat to expectations.
How is it possible to get such an outlier print to not only trends but expectations? Let’s try to answer that question.
If, as the BLS claims, in September the jobs market suddenly reversed a year of declines, surely there will be some qualitative validations to this quantitative outlier, right? Unfortunately, looking through the supporting evidence we don’t find any justification to the BLS exuberance.
Let’s start with the Household survey: here instead of a number anywhere close to the 336K jobs gained (as the far less accurate Establishment survey reports), the number of newly employed workers was just 86K, the lowest since May, and the second lowest of 2023!
And since the number of unemployed workers also rose to 6.360 million, the highest number since January 2022, the unemployment rate was sticky at 3.8%, and refused to drop to 3.7% as consensus had expected.
How about the Establishment survey? Well, here too, things stink. Yes, the headline surge was great, but the question here is how much of that was purely seasonals.
Consider what Vanda Research FX trader Viraj Patel noted earlier: the official adjusted data showed this Leisure and Hospitality added a whopping +96k jobs. But unadjusted data showed that the sector lost 466k jobs in Sep. This means that the unadjusted private sector payrolls was -399!
⚠️ I wonder how much of the payrolls upside is to do with seasonal quirks more than anything. Take Leisure & Hospitality. Official adjusted data shows this add +96k jobs. But unadjusted data shows sector shed 466k jobs in Sep. Unadjusted private sector payrolls was -399k 🤷♂️ $USD pic.twitter.com/ME1VFf4RHp
— Viraj Patel (@VPatelFX) October 6, 2023
Wait, if unadjusted total payrolls rose by 585K and yet private payrolls dropped by 399K, that means that… you got it: in September, all of the unadjusted jobs came from – drumroll – the government, which added a whopping 984K jobs (mostly teachers).
Translation: for yet another month all the strength in the Establishment was thanks to seasonals and various plugs that made the total number much stronger.
And now, let’s turn again to the much more detailed and accurate Household Survey, where we find the BLS back to its old tricks again.
First, as we pointed out earlier, despite the alleged quantitative surge, the quality of the jobs was anything but good. In fact, looking at the infamous table A-9 of the employment report, reveals that in September, a seasonally adjusted breakdown of jobs shows that part-time workers accounted for the entire increase, rising by 151K; as for full-time workers? Well, for yet another month, this number dropped, sliding by 22K in September.
Full-time workers: -22K
Part-time workers: +151K— zerohedge (@zerohedge) October 6, 2023
Indeed, as shown in the chart below, while part-time workers rose for the third consecutive month to 27.336 million,and the highest since January, full-time workers have decline for three straight months, and at 134.167 million, this was the lowest number going back to February!
But hold on, you say, why use Seasonally Adjusted number when we already noted above that there continue to be chronic issues with the BLS’ seasonal adjustments in the post-covid era. True, so let’s use unadjusted numbers instead. What do we get?
Well, we get the following whopper: in September, the number of unadjusted full-time workers collapsed by 885K. This was the biggest monthly drop since – drumroll- April 2020 when the economy was shut down!
And if full-time workers plunged, that must mean that part-timers exploded, right? Why yes, they did: by 1.127 million in one month to be precise, and at 27.109 million the number of part-time workers was the highest since April.
Finally, let’s not forget the number of multiple jobholders: those unlucky souls which have to work not one but two (or more) jobs to make ends meet under Bidenomics. Also, multiple jobholders (which are measured by the Household Survey) are double, and triple- counted when it comes to the Establishment Survey. So how did thy do in September? Well, on a seasonally adjusted basis, the number increased by 123K to 8.151 million, the highest since January 2020. As for the much more accurate, unadjusted number, well that soared from 7.778 million to 8.146 million, an increase of 368K, or more than all the 336K payrolls reported by the establishment survey.
In other words, all of the job gains in September were either from part-time workers or multiple jobholders forced to get another job in addition to their current one, and thus be counted by the BLS as two distinct jobs (or more). One final observation on the multiple jobholders: in September, the subset of multiple jobholders who held both a primary and secondary full-time job just hit an all time high.
Visually, this is what September’s “stunning” jobs report really looked like.
Source for everything: BLS, but one needs to do some actual work to get a sense of what is really going on.
Loading…
