Two days ago we shared the latest thoughts from Morgan Stanley's QDS (quant and derivative desk) discussing what the "market bottom" may look like. Today we turn our attention to a similar line of inquiry, only this time from JPMorgan's flow desk, courtesy of Andrew Tyler (full note available to professional subs).
"When is when?" for the market bottom?
From a flows perspective Nikos Panagirtzoglou feels that a protracted outflow is unlikely and from a positioning perspective John Schlegel and team highlight both the “bear case” from the “bounce case”.
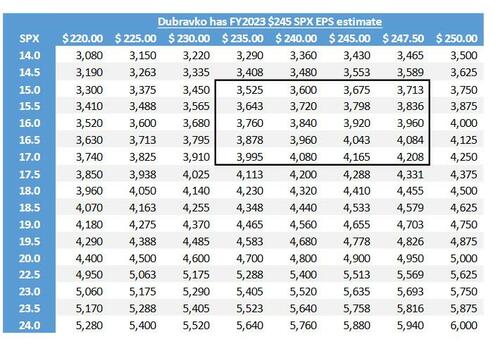
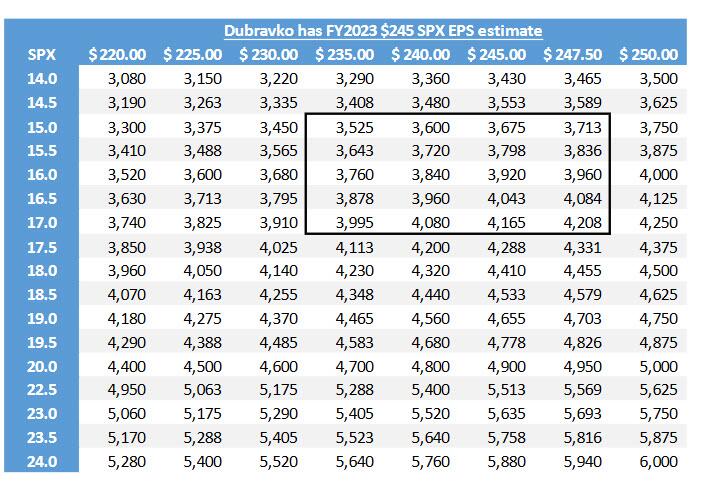
The SPX closed at 15.8x consensus 2023 ($249) estimates and trades at 17.3x CY estimates ($228); the SPX’s lifetime average P/E is 16.9x (BBG). Stocks are not necessarily cheap and it may be the case that investors require a larger discount before jumping in.
From a macro perspective, the China COVID lockdown situation will be adjudicated in a matter of weeks (or months) but one has to wonder about the RU/UKR situation now that we are seeing additional supply disruptions of commodity exports (natgas in this case), Russia beginning to punch back on sanctions (levelling their own), and with Sweden/Finland aiming to join NATO what is Putin’s reaction function?
Mapping back to the US, the more time spent at elevated inflation will increase the fear that the Fed eventually has to step-up its tightening efforts, which typically ends in a recession. The counterargument to this last point is, how much farther beyond neutral would the Fed have to go to counteract the elevated consumer cash pile?
Further, recessions typically are initiated by a credit crunch that leads to higher unemployment. Given the state of corporate balance sheets, how quickly could these conditions change to force some distress?

Next, looking at the latest equity fund flow data, JPM is skeptical of the idea that April’s equity fund outflow, the highest outflow since March 2020, is only the beginning of a likely more protracted phase of outflows in reversal to 2021’s record inflows.
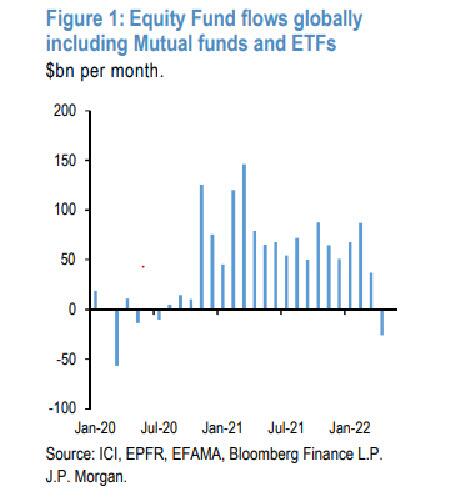
By taking into account both flows and performance, the bank calculates that equity funds globally lost $6.1tr of AUM YTD, effectively reversing 60% of last year’s increase. At the same time, bond funds lost $2.1tr of AUM YTD, reversing 80% of last year’s increase.
In addition, the younger cohorts of US retail investors, which have been investing in the equity market via individual stocks rather than equity funds, have been de-risking since at least last October and their de-risking appears to be well advanced.
Shifting away from fundamentals, in its search for a bottom, JPMorgan next look at where else could positioning still fall and how
extreme is positioning now?
As we try to assess when we might see a bottom, where are there places where positioning could still fall:
1. Aggregate positioning levels...more room to fall to get to prior extremes? The average 1-yr z-score is near a -2z level (i.e. quite low) for the 6 positioning level metrics in our Tactical Positioning Monitor (TPM). However, when using the full historical data available for each time series, the low was -1.4z in Feb 2016, -1.8z in Dec 2018, and -1.6z in Mar 2020. This compares to the latest reading as of Mon at only -0.8z, i.e. there’s still room for this to fall.
2. Retail flows...could we see larger capitulation? When we look at the single-stock flow, the shift towards less buying / more selling over the past 6 months is quite notable. That said, the magnitude of buying in 2020 (post March) through late 2021 was quite large (i.e. selling could take some time to reverse this) and the recent selling has not quite hit the same levels we saw at the end of 2018 or March 2020.
3. ETF flows...does the euphoric rise in 2021 have to fall back to earth? Looking at the rolling 12M inflows to US ETFs, the outsized inflows in 2021 are fairly apparent. Given the lows we saw in late 2011, late 2015, and late 2018, all of which coincided with market lows, could this be something that continues to deflate and generally creates headwinds for the market until it’s done falling?
As JPM concedes, these are all fairly “bear case” scenarios and not ones that have to play out per se, but given the way the market has been behaving recently, the bank "cannot rule out something like this playing out over time."
On the other hand, and from a more tactical (i.e. very near term) standpoint, the bank writes that there are multiple metrics that suggest we could be closer to a bounce than before, including:
- The magnitude of the drawdown in net and gross exposures (-33% for net and - 30% for gross) in N. America among L/S funds is now similar to the early 2016 and March 2020 declines
- Retail flows in single-stocks have been very negative over the past 3 days, which has generally coincided with short-term lows over the past 6 months.
- The drawdown in “risky” factors (e.g. high vol, small cap, low profitability) is one of the most extreme of the past 20+ years and the S&P has rallied over the following 1-3 months post hitting similar extremes
- Buying of Defensives and selling of Cyclicals is also one of the most extreme with Staples vs. Discretionary in particular looking stretched
Next, turning attention to retail traders, who as we explained previously have emerged as the marginal price setters in a market where hedge funds have massively degrossed/delevered, JPM writes that "retail traders net bought $1.1B in the equity market this past week, 1.5 standard deviations below the 1Y average of $3.3B." But more notably they turned outright sellers this week and sold a combined $1.9B in the last two days, which represented the largest two-day outflow in 14 months.
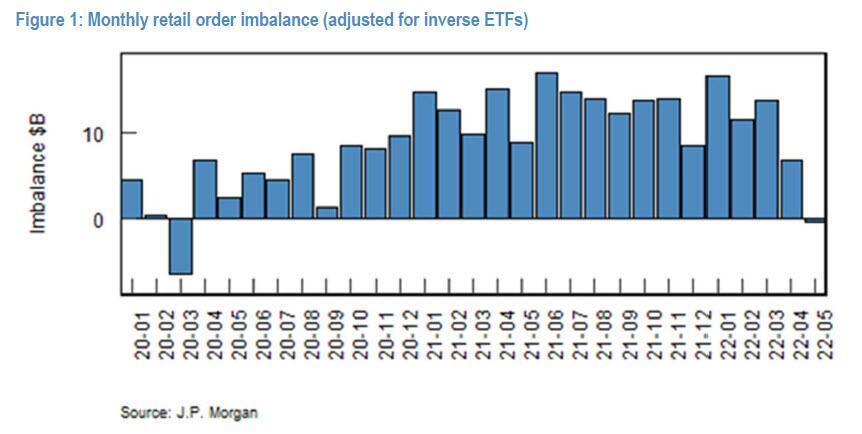
Indeed, as we discussed on Tuesday, the retail buying impulse showed signs of slowing before this latest burst of selling. After adjusting for inverse ETFs, not only is the May MTD net flow negative for the first time since Mar-2020, but also the monthly inflow in April was smallest since Sep-2020.
According to JPM, "the recent market performance undoubtedly played an important role in retail traders’ bearish turn." Looking ahead, the bank estimates that retail traders collectively made approximately 6% return since Jan-2020, significantly underperforming the 24% return of the S&P 500...
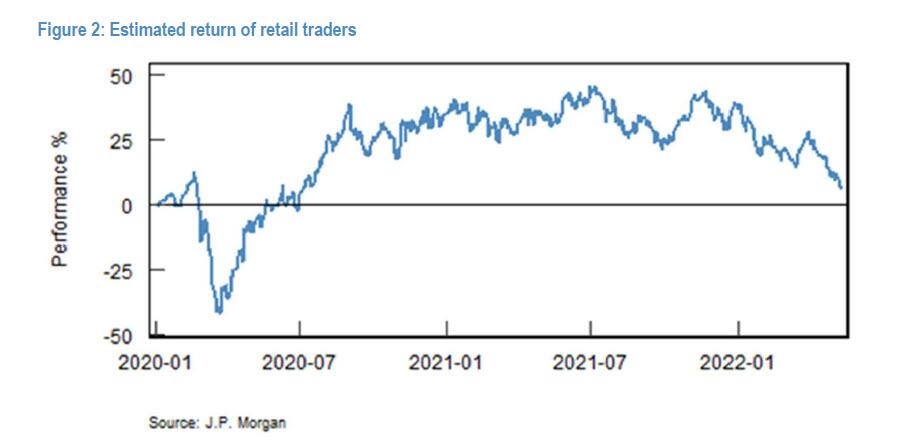
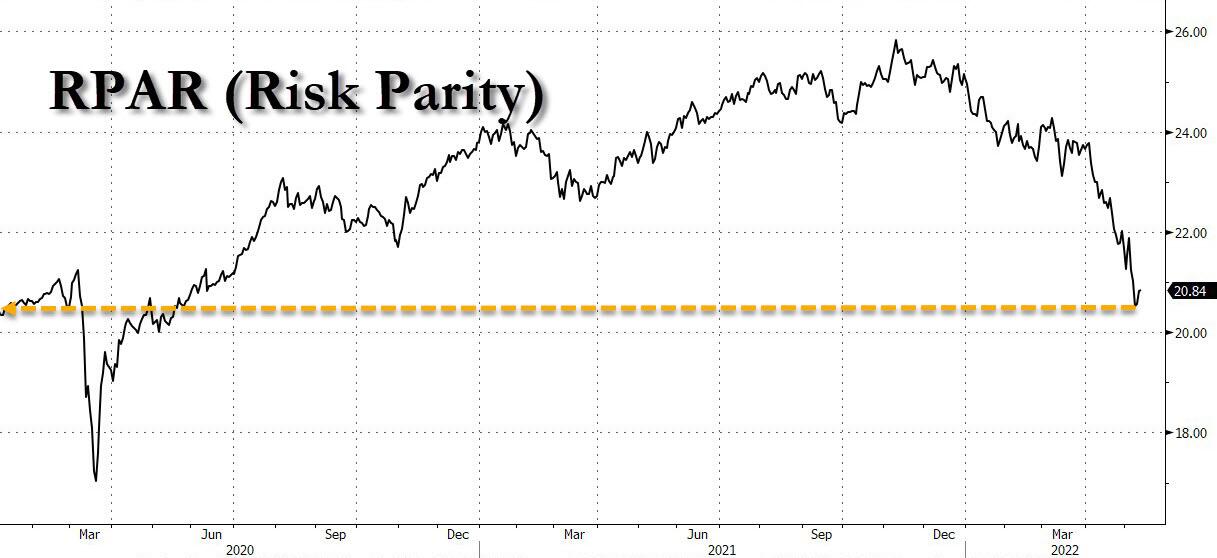
... although they appear to be outperforming the much more "sophisticated" risk parity funds who are red since Jan 2020.
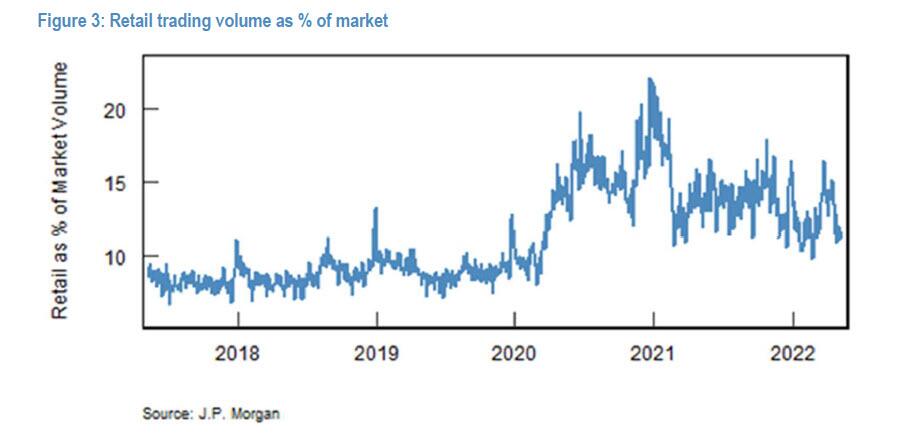
Much of the gains made during the pandemic were given back in the last six months. Their activities have also declined, and currently account for approximately 12% of the market volume, down from around 20% at the peak in Jan 2021.

In the options market, retail traders bought $1.6B of delta. SPY/SPX accounted for ~$900MM of the imbalance, and QQQ ~$400MM. TSLA contributed to another $400MM in delta, mostly in the form of put selling. Gamma continued to be in demand (+$1.1B imbalance). UVXY remained one of the retail favorites, and represented a net buying of ~9MM Vega in VIX futures.
Non-retail market order net sold -$11B this past week. Rotation was observed in favor of the Energy sector (1Y Z-score +2.5) over Technology (-1.9z). Similarly, in the factor space, Value was bought (+1.5z) vs. Quality sold (-2.5z).
* * *
Finally, going back to a point we made earlier this week, that the bottom this time won't be a capitulatory puke, but more likely consistent selling which fades as it burns out, to wit:
... signs of a market bottom are unlikely to resemble traditional "capitulation" that’s played out in the last few years. Why? Because traditional capitulation is typically marked by a quick de-grossing by hedge funds + systematic macro strategies, where positioning is already light. Instead, the next leg of de-risking is likely to be more gradual, coming from asset allocators/real money/retail and is therefore likely slower to play out, making a precise bottom more difficult to call.
... we first note that as of this morning, the max drawdown in the Nasdaq from its all time high to today has surpassed 30% and is now more than the March 2020 pandemic crash...

... and according to SpotGamma, "it seems clear there is major delevering/degrossing (aka “natural sellers”) and that may be what is bringing the large, persistent selling. Put holders aren’t materially closing positions, and they aren’t doing much buying either."
As SpotGamma further writes, this is still a tale of “many markets” wherein stock correlations have not moved to one, and as a result, there hasn’t been any index capitulation (yet) with certain stocks fairing relatively well. Take AAPL for example which is “top quality”, and you can see that IV’s are elevated but not “jumping” increasing despite lower-lows.
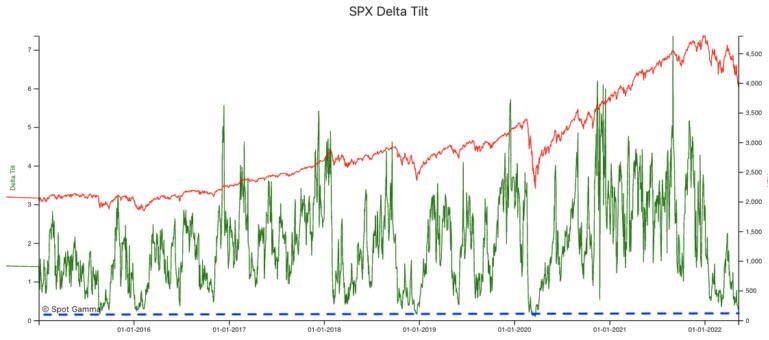
Still, with this last SPX move lower, SpotGamma's Delta Tilt reading now matches that of previous major lows, suggesting again that we are at “peak puts”, and (barring a massive rally) there is little to change this signal before 5/20 wherein we’ll lose about 25% of total S&P500 gamma.

Looking ahead, SpotGamma predicts that there is no reason here for volatility sellers to step in, or for puts to be covered, until the May 20 op-ex. That expiration will force some put covering, and the question is will the positive deltas flowing from OPEX be enough to overwhelm whatever “natural sellers” remain.
For more, please read the full JPM note available to professional subs in the usual place.
Two days ago we shared the latest thoughts from Morgan Stanley’s QDS (quant and derivative desk) discussing what the “market bottom” may look like. Today we turn our attention to a similar line of inquiry, only this time from JPMorgan’s flow desk, courtesy of Andrew Tyler (full note available to professional subs).
“When is when?” for the market bottom?
From a flows perspective Nikos Panagirtzoglou feels that a protracted outflow is unlikely and from a positioning perspective John Schlegel and team highlight both the “bear case” from the “bounce case”.
The SPX closed at 15.8x consensus 2023 ($249) estimates and trades at 17.3x CY estimates ($228); the SPX’s lifetime average P/E is 16.9x (BBG). Stocks are not necessarily cheap and it may be the case that investors require a larger discount before jumping in.
From a macro perspective, the China COVID lockdown situation will be adjudicated in a matter of weeks (or months) but one has to wonder about the RU/UKR situation now that we are seeing additional supply disruptions of commodity exports (natgas in this case), Russia beginning to punch back on sanctions (levelling their own), and with Sweden/Finland aiming to join NATO what is Putin’s reaction function?
Mapping back to the US, the more time spent at elevated inflation will increase the fear that the Fed eventually has to step-up its tightening efforts, which typically ends in a recession. The counterargument to this last point is, how much farther beyond neutral would the Fed have to go to counteract the elevated consumer cash pile?
Further, recessions typically are initiated by a credit crunch that leads to higher unemployment. Given the state of corporate balance sheets, how quickly could these conditions change to force some distress?
Next, looking at the latest equity fund flow data, JPM is skeptical of the idea that April’s equity fund outflow, the highest outflow since March 2020, is only the beginning of a likely more protracted phase of outflows in reversal to 2021’s record inflows.

By taking into account both flows and performance, the bank calculates that equity funds globally lost $6.1tr of AUM YTD, effectively reversing 60% of last year’s increase. At the same time, bond funds lost $2.1tr of AUM YTD, reversing 80% of last year’s increase.

In addition, the younger cohorts of US retail investors, which have been investing in the equity market via individual stocks rather than equity funds, have been de-risking since at least last October and their de-risking appears to be well advanced.
Shifting away from fundamentals, in its search for a bottom, JPMorgan next look at where else could positioning still fall and how
extreme is positioning now?
As we try to assess when we might see a bottom, where are there places where positioning could still fall:
1. Aggregate positioning levels…more room to fall to get to prior extremes? The average 1-yr z-score is near a -2z level (i.e. quite low) for the 6 positioning level metrics in our Tactical Positioning Monitor (TPM). However, when using the full historical data available for each time series, the low was -1.4z in Feb 2016, -1.8z in Dec 2018, and -1.6z in Mar 2020. This compares to the latest reading as of Mon at only -0.8z, i.e. there’s still room for this to fall.
2. Retail flows…could we see larger capitulation? When we look at the single-stock flow, the shift towards less buying / more selling over the past 6 months is quite notable. That said, the magnitude of buying in 2020 (post March) through late 2021 was quite large (i.e. selling could take some time to reverse this) and the recent selling has not quite hit the same levels we saw at the end of 2018 or March 2020.
3. ETF flows…does the euphoric rise in 2021 have to fall back to earth? Looking at the rolling 12M inflows to US ETFs, the outsized inflows in 2021 are fairly apparent. Given the lows we saw in late 2011, late 2015, and late 2018, all of which coincided with market lows, could this be something that continues to deflate and generally creates headwinds for the market until it’s done falling?
As JPM concedes, these are all fairly “bear case” scenarios and not ones that have to play out per se, but given the way the market has been behaving recently, the bank “cannot rule out something like this playing out over time.”
On the other hand, and from a more tactical (i.e. very near term) standpoint, the bank writes that there are multiple metrics that suggest we could be closer to a bounce than before, including:
- The magnitude of the drawdown in net and gross exposures (-33% for net and – 30% for gross) in N. America among L/S funds is now similar to the early 2016 and March 2020 declines
- Retail flows in single-stocks have been very negative over the past 3 days, which has generally coincided with short-term lows over the past 6 months.
- The drawdown in “risky” factors (e.g. high vol, small cap, low profitability) is one of the most extreme of the past 20+ years and the S&P has rallied over the following 1-3 months post hitting similar extremes
- Buying of Defensives and selling of Cyclicals is also one of the most extreme with Staples vs. Discretionary in particular looking stretched
Next, turning attention to retail traders, who as we explained previously have emerged as the marginal price setters in a market where hedge funds have massively degrossed/delevered, JPM writes that “retail traders net bought $1.1B in the equity market this past week, 1.5 standard deviations below the 1Y average of $3.3B.” But more notably they turned outright sellers this week and sold a combined $1.9B in the last two days, which represented the largest two-day outflow in 14 months.
Indeed, as we discussed on Tuesday, the retail buying impulse showed signs of slowing before this latest burst of selling. After adjusting for inverse ETFs, not only is the May MTD net flow negative for the first time since Mar-2020, but also the monthly inflow in April was smallest since Sep-2020.

According to JPM, “the recent market performance undoubtedly played an important role in retail traders’ bearish turn.” Looking ahead, the bank estimates that retail traders collectively made approximately 6% return since Jan-2020, significantly underperforming the 24% return of the S&P 500…

… although they appear to be outperforming the much more “sophisticated” risk parity funds who are red since Jan 2020.

Much of the gains made during the pandemic were given back in the last six months. Their activities have also declined, and currently account for approximately 12% of the market volume, down from around 20% at the peak in Jan 2021.
In the options market, retail traders bought $1.6B of delta. SPY/SPX accounted for ~$900MM of the imbalance, and QQQ ~$400MM. TSLA contributed to another $400MM in delta, mostly in the form of put selling. Gamma continued to be in demand (+$1.1B imbalance). UVXY remained one of the retail favorites, and represented a net buying of ~9MM Vega in VIX futures.
Non-retail market order net sold -$11B this past week. Rotation was observed in favor of the Energy sector (1Y Z-score +2.5) over Technology (-1.9z). Similarly, in the factor space, Value was bought (+1.5z) vs. Quality sold (-2.5z).
* * *
Finally, going back to a point we made earlier this week, that the bottom this time won’t be a capitulatory puke, but more likely consistent selling which fades as it burns out, to wit:
… signs of a market bottom are unlikely to resemble traditional “capitulation” that’s played out in the last few years. Why? Because traditional capitulation is typically marked by a quick de-grossing by hedge funds + systematic macro strategies, where positioning is already light. Instead, the next leg of de-risking is likely to be more gradual, coming from asset allocators/real money/retail and is therefore likely slower to play out, making a precise bottom more difficult to call.
… we first note that as of this morning, the max drawdown in the Nasdaq from its all time high to today has surpassed 30% and is now more than the March 2020 pandemic crash…

… and according to SpotGamma, “it seems clear there is major delevering/degrossing (aka “natural sellers”) and that may be what is bringing the large, persistent selling. Put holders aren’t materially closing positions, and they aren’t doing much buying either.”
As SpotGamma further writes, this is still a tale of “many markets” wherein stock correlations have not moved to one, and as a result, there hasn’t been any index capitulation (yet) with certain stocks fairing relatively well. Take AAPL for example which is “top quality”, and you can see that IV’s are elevated but not “jumping” increasing despite lower-lows.
Still, with this last SPX move lower, SpotGamma’s Delta Tilt reading now matches that of previous major lows, suggesting again that we are at “peak puts”, and (barring a massive rally) there is little to change this signal before 5/20 wherein we’ll lose about 25% of total S&P500 gamma.
Looking ahead, SpotGamma predicts that there is no reason here for volatility sellers to step in, or for puts to be covered, until the May 20 op-ex. That expiration will force some put covering, and the question is will the positive deltas flowing from OPEX be enough to overwhelm whatever “natural sellers” remain.
For more, please read the full JPM note available to professional subs in the usual place.