Heading into tomorrow's main event - the nonfarm payrolls print (which is the appetizer for CPI next Wednesday), JPMorgan's trading desk asked a rhetorical question: what's better for markets: 50K or 400K jobs for NFP?
It answered as follows: "50K NFP gets the Fed closer to “Mission Accomplished” as they are nearly there with housing markets (lower prices pending). I think a 400k print would have bond yields reprice higher, potentially taking the 10Y yield above 3% which has acted as a resistance point for Equities, recently."
In other words, good news is bad, and bad news is great news, precisely as we said would be the norm moments after last week's Powell presser in which he said that forward guidance is now dead and instead the Fed is data dependent.
Goldman agrees, and flow trader John Flood writes in his EOD wrap that "we are firmly in a BAD is GOOD and vice versa tape right now." He adds that whereas Goldman estimates a +225k headline print (vs +372 prior and +250k consensus). In this context:
- The market "will get hit hard (-200bps) on a print north of 372k (>prior reading) as sooner than expected “fed pivot” convos will quickly be shelved."
- On the other hand, "a relatively inline print (150k – 300k) mkt wont react to as traders will sit on hands and wait for CPI."
- Finally, "if jobs are lost and we get a negative print, tape will rally 100+bps as FOMO/COVER chase will (remain) on w/ early 2023 rate cut discussions gaining more momentum."
Taking a step back, let's take a look at what Wall Street expects tomorrow courtesy of Newsquawk:
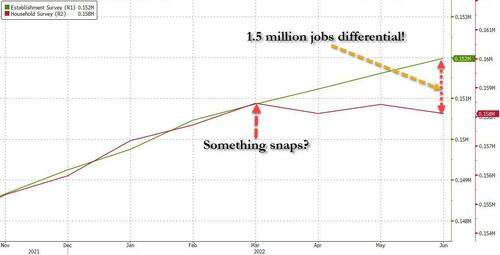
- In July, the US economy is expected to add 250k nonfarm payrolls in July, with the pace of payroll additions cooling again amid tight labor market conditions. However, as we first observed one month ago, the slowdown in the Establishment survey has already been apparent in the Household Survey where there has been no jobs growth since March.
- The unemployment rate is expected to be unchanged at 3.6%.
- Average hourly earnings are expected to rise 0.3% from June and 4.9% from a year ago, down from the 5.1% increase a month earlier.
- The July jobs report will also give us a glimpse of how the key initial data prints from Q3 are shaping up, and whether there was anything more to the ‘technical’ weakness seen in Q2. If the headline were to significantly top the consensus estimate, it would add fuel to the argument that the labor market remains strong, and provide the Fed with scope to lift rates by a larger increment if it deemed necessary.
- Conversely, a downside surprise would add to arguments highlighting slowing growth momentum in the US, and embolden those who have suggested that the central bank will need to lower rates next year to support an economy that is falling into a recession.
Wage inflation:
- Average hourly earnings are expected to rise by 0.3% M/M in July, matching the rate of the prior month, while the annual measure is seen easing by 0.2ppts to 4.9% Y/Y.
- Analysts have recently noted that various measures of wage growth are sending conflicting signals: the component within the jobs report has been easing in the first half of the year, but the Atlanta Fed’s Wage Growth Tracker has been rising, for instance.
- In terms of the Fed’s own focus, at his post-meeting press conference in July, Chair Powell flagged the Employment Cost Index series as a key metric that officials would consider when setting policy. And within the Q2 ECI report, the wages and salaries component, which analysts use as a gauge of labor market tightness, rose by 1.6% on a three-month seasonally adjusted basis, picking-up from the previous 1.3%; at an annualized rate, this equates to around 6.5% Y/Y, according to Pantheon Macroeconomics.
- “Wage gains at this pace are far too high for the Fed, because they would require implausible rapid productivity growth in order to be consistent with the inflation target in the medium-term,” it said, “a lot more data will be released before the September Fed meeting, but this is not a great start for investors looking for the Fed to slow the pace of tightening.”
- Going forward, Goldman Sachs (which projects nonfarm payrolls rose by 225k in July, 25k below consensus and a slowdown from the +372k pace in June) expects wage growth to begin slowing, and offers three reasons to support this argument:
- the firmness in wage growth last year and early 2022 was likely a reflection of one-off factors related to the pandemic that are no longer relevant,
- the breadth of wage gains has fallen in recent months,
- forward-looking wage growth expectations have started to moderate.
Policy Significance:
- Fed officials have been looking through recent growth data that showed the US economy contract for two consecutive quarters, which some define as a ‘technical’ recession. Policymakers have argued that US economic performance is not consistent with recessionary conditions, with their case heavily premised on job gains being robust in recent months, and the unemployment rate remaining low.
- July’s data will perhaps carry more weight than in recent months since it could be more influential in determining the outcome of the September FOMC meeting. The Fed has indicated that it is now setting policy on a meeting-by-meeting basis, where incoming data will be the basis of its policy decisions; that said, the central bank has also suggested that inflation remains its primary policy focus, and it is prepared to take monetary policy into restrictive territory to cap the upside surge in prices, and accordingly, the central bank is still expected to aggressively tighten rates, with many officials noting that there is much work to be done to bring inflation back down.
- Currently, money market pricing for the September FOMC meeting is split between a rate hike of 50bps or 75bps from the current 2.25-2.50% neutral level; beyond September, markets are betting that rates will rise to 3.25-3.50% by year-end, before easing to 2.75-3.00% over the course of 2023.
Market reaction:
- Traders will use the data to shape expectations of how the Fed will set policy at its September meeting: the central bank is in a data-dependent, meeting-by-meeting mode, as it focuses on bringing inflation back to target.
- Accordingly, any upside surprise for the headline and wages will give the central bank scope to move rates higher by a larger increment in September, whereas any downside surprise to the headline may indicate that the slowing growth momentum has crept into Q3, and any downside surprise in the wages component may allow the central bank to revert to a smaller increment of rate hikes.
Arguing for a weaker-than-expected report:
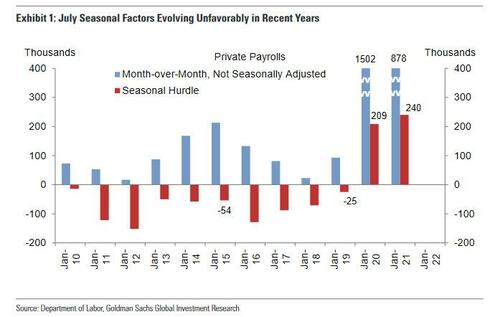
- Seasonal factors. The July seasonal factors have evolved unfavorably in recent years, with a month-over-month hurdle for private payrolls of +240k in July 2021 and +209k in July 2020 compared to negative hurdles throughout the 2010s (including -54k in July 2015, which was also a 5-week July payroll months; see Exhibit 1). There is a possibility that the July seasonal factors are overfitting to the reopening-related job surges in the summer of 2020 and 2021. This higher seasonal hurdle represents a headwind of roughly 250k, in our view, other things equal. Goldman also believes a difficult seasonal factor weighed on the June report (by roughly 200k).
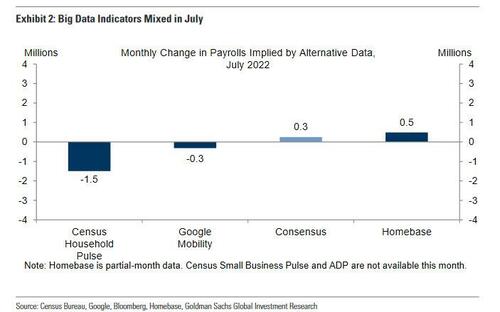
- Big Data. High-frequency data on the labor market generally were mixed in July, with a solid rise in the Homebase data but outright declines in the Google and Census Pulse measures. However, Big Data measures generally understated BLS payroll growth in Q2 (which may suggest that BLS payroll data is overstated).
- Jobless claims. Initial jobless claims increased from very low levels during the July payroll month, averaging 243k per week vs. 225k in June. Continuing claims in regular state programs increased 44k from survey week to survey week. Employer surveys. The employment components of business surveys generally decreased in July. Our services survey employment tracker decreased by 0.4pt to 54.0 and our manufacturing survey employment tracker decreased by 0.6pt to 55.2.
Arguing for a stronger-than-expected report:
- Education seasonality. We assume +75k for the education sector in tomorrow’s report (mom sa, public and private). Education payrolls remain 200k below pre-crisis (public and private), and we expect fewer-than-normal janitors and support staff leaving for the summer.
- Job cuts. Announced layoffs reported by Challenger, Gray & Christmas decreased 15.0% month-over-month in July, after increasing 79.0% in June (SA by GS). Job availability. The Conference Board labor differential—the difference between the percent of respondents saying jobs are plentiful and those saying jobs are hard to get—declined by 2.1pt to +37.8 but remained high. JOLTS job openings decreased by 605k in June to 10.7mn but remain very elevated.
Neutral/mixed factors:
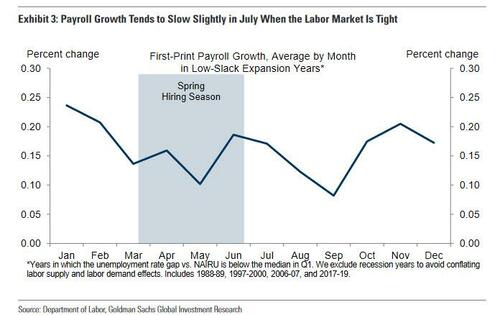
- Labor supply constraints. When the labor market is tight, job growth tends to slow but remain strong in July, as shown in Exhibit 3. This may reflect the arrival of the summer youth labor force and an associated easing in hiring difficulty.
- ADP. The ADP report was not published this month as the company revamps their model. ADP is targeting August 31 for their next update.
Heading into tomorrow’s main event – the nonfarm payrolls print (which is the appetizer for CPI next Wednesday), JPMorgan’s trading desk asked a rhetorical question: what’s better for markets: 50K or 400K jobs for NFP?
It answered as follows: “50K NFP gets the Fed closer to “Mission Accomplished” as they are nearly there with housing markets (lower prices pending). I think a 400k print would have bond yields reprice higher, potentially taking the 10Y yield above 3% which has acted as a resistance point for Equities, recently.”
In other words, good news is bad, and bad news is great news, precisely as we said would be the norm moments after last week’s Powell presser in which he said that forward guidance is now dead and instead the Fed is data dependent.
Goldman agrees, and flow trader John Flood writes in his EOD wrap that “we are firmly in a BAD is GOOD and vice versa tape right now.” He adds that whereas Goldman estimates a +225k headline print (vs +372 prior and +250k consensus). In this context:
- The market “will get hit hard (-200bps) on a print north of 372k (>prior reading) as sooner than expected “fed pivot” convos will quickly be shelved.”
- On the other hand, “a relatively inline print (150k – 300k) mkt wont react to as traders will sit on hands and wait for CPI.”
- Finally, “if jobs are lost and we get a negative print, tape will rally 100+bps as FOMO/COVER chase will (remain) on w/ early 2023 rate cut discussions gaining more momentum.”
Taking a step back, let’s take a look at what Wall Street expects tomorrow courtesy of Newsquawk:
- In July, the US economy is expected to add 250k nonfarm payrolls in July, with the pace of payroll additions cooling again amid tight labor market conditions. However, as we first observed one month ago, the slowdown in the Establishment survey has already been apparent in the Household Survey where there has been no jobs growth since March.
- The unemployment rate is expected to be unchanged at 3.6%.
- Average hourly earnings are expected to rise 0.3% from June and 4.9% from a year ago, down from the 5.1% increase a month earlier.
- The July jobs report will also give us a glimpse of how the key initial data prints from Q3 are shaping up, and whether there was anything more to the ‘technical’ weakness seen in Q2. If the headline were to significantly top the consensus estimate, it would add fuel to the argument that the labor market remains strong, and provide the Fed with scope to lift rates by a larger increment if it deemed necessary.
- Conversely, a downside surprise would add to arguments highlighting slowing growth momentum in the US, and embolden those who have suggested that the central bank will need to lower rates next year to support an economy that is falling into a recession.
Wage inflation:
- Average hourly earnings are expected to rise by 0.3% M/M in July, matching the rate of the prior month, while the annual measure is seen easing by 0.2ppts to 4.9% Y/Y.
- Analysts have recently noted that various measures of wage growth are sending conflicting signals: the component within the jobs report has been easing in the first half of the year, but the Atlanta Fed’s Wage Growth Tracker has been rising, for instance.
- In terms of the Fed’s own focus, at his post-meeting press conference in July, Chair Powell flagged the Employment Cost Index series as a key metric that officials would consider when setting policy. And within the Q2 ECI report, the wages and salaries component, which analysts use as a gauge of labor market tightness, rose by 1.6% on a three-month seasonally adjusted basis, picking-up from the previous 1.3%; at an annualized rate, this equates to around 6.5% Y/Y, according to Pantheon Macroeconomics.
- “Wage gains at this pace are far too high for the Fed, because they would require implausible rapid productivity growth in order to be consistent with the inflation target in the medium-term,” it said, “a lot more data will be released before the September Fed meeting, but this is not a great start for investors looking for the Fed to slow the pace of tightening.”
- Going forward, Goldman Sachs (which projects nonfarm payrolls rose by 225k in July, 25k below consensus and a slowdown from the +372k pace in June) expects wage growth to begin slowing, and offers three reasons to support this argument:
- the firmness in wage growth last year and early 2022 was likely a reflection of one-off factors related to the pandemic that are no longer relevant,
- the breadth of wage gains has fallen in recent months,
- forward-looking wage growth expectations have started to moderate.
Policy Significance:
- Fed officials have been looking through recent growth data that showed the US economy contract for two consecutive quarters, which some define as a ‘technical’ recession. Policymakers have argued that US economic performance is not consistent with recessionary conditions, with their case heavily premised on job gains being robust in recent months, and the unemployment rate remaining low.
- July’s data will perhaps carry more weight than in recent months since it could be more influential in determining the outcome of the September FOMC meeting. The Fed has indicated that it is now setting policy on a meeting-by-meeting basis, where incoming data will be the basis of its policy decisions; that said, the central bank has also suggested that inflation remains its primary policy focus, and it is prepared to take monetary policy into restrictive territory to cap the upside surge in prices, and accordingly, the central bank is still expected to aggressively tighten rates, with many officials noting that there is much work to be done to bring inflation back down.
- Currently, money market pricing for the September FOMC meeting is split between a rate hike of 50bps or 75bps from the current 2.25-2.50% neutral level; beyond September, markets are betting that rates will rise to 3.25-3.50% by year-end, before easing to 2.75-3.00% over the course of 2023.
Market reaction:
- Traders will use the data to shape expectations of how the Fed will set policy at its September meeting: the central bank is in a data-dependent, meeting-by-meeting mode, as it focuses on bringing inflation back to target.
- Accordingly, any upside surprise for the headline and wages will give the central bank scope to move rates higher by a larger increment in September, whereas any downside surprise to the headline may indicate that the slowing growth momentum has crept into Q3, and any downside surprise in the wages component may allow the central bank to revert to a smaller increment of rate hikes.
Arguing for a weaker-than-expected report:
- Seasonal factors. The July seasonal factors have evolved unfavorably in recent years, with a month-over-month hurdle for private payrolls of +240k in July 2021 and +209k in July 2020 compared to negative hurdles throughout the 2010s (including -54k in July 2015, which was also a 5-week July payroll months; see Exhibit 1). There is a possibility that the July seasonal factors are overfitting to the reopening-related job surges in the summer of 2020 and 2021. This higher seasonal hurdle represents a headwind of roughly 250k, in our view, other things equal. Goldman also believes a difficult seasonal factor weighed on the June report (by roughly 200k).
- Big Data. High-frequency data on the labor market generally were mixed in July, with a solid rise in the Homebase data but outright declines in the Google and Census Pulse measures. However, Big Data measures generally understated BLS payroll growth in Q2 (which may suggest that BLS payroll data is overstated).
- Jobless claims. Initial jobless claims increased from very low levels during the July payroll month, averaging 243k per week vs. 225k in June. Continuing claims in regular state programs increased 44k from survey week to survey week. Employer surveys. The employment components of business surveys generally decreased in July. Our services survey employment tracker decreased by 0.4pt to 54.0 and our manufacturing survey employment tracker decreased by 0.6pt to 55.2.
Arguing for a stronger-than-expected report:
- Education seasonality. We assume +75k for the education sector in tomorrow’s report (mom sa, public and private). Education payrolls remain 200k below pre-crisis (public and private), and we expect fewer-than-normal janitors and support staff leaving for the summer.
- Job cuts. Announced layoffs reported by Challenger, Gray & Christmas decreased 15.0% month-over-month in July, after increasing 79.0% in June (SA by GS). Job availability. The Conference Board labor differential—the difference between the percent of respondents saying jobs are plentiful and those saying jobs are hard to get—declined by 2.1pt to +37.8 but remained high. JOLTS job openings decreased by 605k in June to 10.7mn but remain very elevated.
Neutral/mixed factors:
- Labor supply constraints. When the labor market is tight, job growth tends to slow but remain strong in July, as shown in Exhibit 3. This may reflect the arrival of the summer youth labor force and an associated easing in hiring difficulty.
- ADP. The ADP report was not published this month as the company revamps their model. ADP is targeting August 31 for their next update.


