Authored by Ryan McMaken via The Mises Institute,
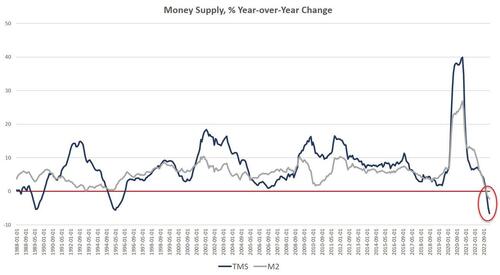
Money supply growth fell again in February, falling even further into negative territory after turning negative in November 2022 for the first time in twenty-eight years. February's drop continues a steep downward trend from the unprecedented highs experienced during much of the past two years.
Since April 2021, money supply growth has slowed quickly, and since November, we've been seeing the money supply contract for the first time since the 1990s. The last time the year-over-year (YOY) change in the money supply slipped into negative territory was in November 1994. At that time, negative growth continued for fifteen months, finally turning positive again in January 1996.
During February 2023, the downturn became even bigger as YOY growth in the money supply was at –6.6 percent. That's down from January's rate of –5.0 percent, and down from February 2022's rate of 6.9 percent. With negative growth now dipping below –6 percent, money-supply contraction is approaching the biggest declines we've seen in decades. At no point for at least sixty years has the money supply fallen by more than 5.6 percent in any month.
The money supply metric used here—the "true," or Rothbard-Salerno, money supply measure (TMS)—is the metric developed by Murray Rothbard and Joseph Salerno, and is designed to provide a better measure of money supply fluctuations than M2.
The Mises Institute now offers regular updates on this metric and its growth. This measure of the money supply differs from M2 in that it includes Treasury deposits at the Fed (and excludes short-time deposits and retail money funds).
In recent months, M2 growth rates have followed a similar course to TMS growth rates, although TMS has fallen faster than M2. In February 2023, the M2 growth rate was –2.2 percent. That's down from January's growth rate of –1.7 percent. February's rate was also well down from February 2022's rate of 10.5 percent.
Money supply growth can often be a helpful measure of economic activity and an indicator of coming recessions. During periods of economic boom, money supply tends to grow quickly as commercial banks make more loans. Recessions, on the other hand, tend to be preceded by slowing rates of money supply growth.
Negative money supply growth is not in itself an especially meaningful metric. But the drop into negative territory we've seen in recent months does help illustrate just how far and how rapidly money supply growth has fallen. That is generally a red flag for economic growth and employment.
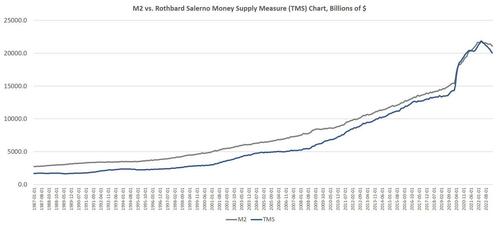
The fact that the money supply is shrinking at all is so remarkable because the money supply almost never gets smaller. The money supply has now fallen by $1.7 trillion (or eight percent) since the peak in April 2022. In raw numbers, that's certainly the largest fall we've seen. But we can see in the next graph why, in percentage terms, the drop doesn't beat those of the late 80s and early 90s. Money creation since 2009—and especially since 2020—has been so large that even a drop of $1 trillion is relatively small in percentage terms. Rather, the money supply would have to drop another $5 trillion or so—or more than 25 percent—just to return to the pre-2009 trend.
In fact, since 2009, the TMS money supply has grown by 200 percent. (M2 has grown by 149 percent in that period.) Out of the current money supply of $20 trillion, $5.8 trillion of that has been created since January 2020—or 28 percent. Since 2009, $13.4 trillion of the current money supply has been created. In other words, nearly two-thirds of the money supply have been created over the past thirteen years.
With these kinds of totals, an eight-percent drop puts a fairly small dent in the huge edifice of newly created money. The US economy still faces a very large monetary overhang from the past several years, and this is partly why after nine months of slowing money-supply growth, we are not yet seeing a sizable slowdown in the labor market.
Nonetheless, the monetary slowdown has been sufficient to considerably weaken the economy. Home prices have fallen. Credit card debt has soared, consumer loan delinquencies are up, job openings are falling, and the manufacturing outlook is falling.
We've seen these trends continue in March of this year as well. In March, growth in consumer loans fell almost to zero.
Money Supply and Rising Interest Rates
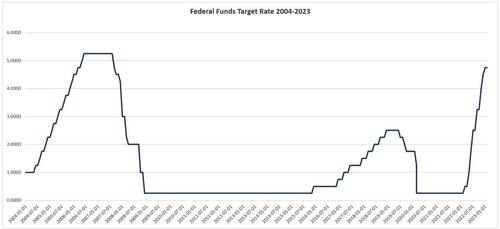
Not surprisingly, this comes after the Federal Reserve finally pulled its foot slightly off the money-creation accelerator after more than a decade of quantitative easing, financial repression, and a general devotion to easy money. The Fed has allowed the federal funds rate to rise to five percent. This has also meant short-term interest rates overall have risen as well. In March, for example, the yield on 3-month Treasurys is approaching the highest level measured in 16 years.
This means trouble for all the zombie companies and banks that have become heavily dependent on easy money. As explained by Daniel Lacalle, the long period of easy money ended up getting banks heavily dependent on low-interest longer-term Treasury and mortgage-backed securities. Now mounting price inflation has forced the Fed to allow interest rates to rise slightly, however. Now, banks find they don't have enough interest income coming in—i.e., income from those older low-interest securities—to pay the bank's bills in the current era of higher interest rates. The first problem signs of this yield mismatch have appeared with the failures of Silicon Valley Bank and Signature Bank.
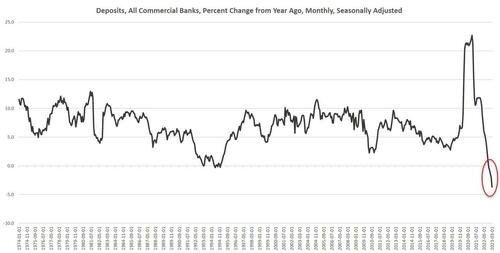
Banks are therefore reluctant to raise interest rates on deposits, and this has led to a historic decline in bank deposits with March deposits falling deeper into negative territory than in any other month in more than 50 years.
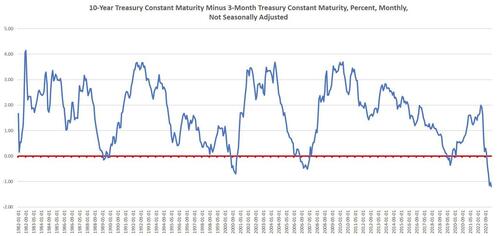
This is all connected to falling money-supply growth, as well. As Bob Murphy notes in his book Understanding Money Mechanics, a sustained decline in TMS growth often reflects spikes in short-term yields, which can fuel a flattening or inverting yield curve—which strongly suggests a recession is approaching. For example, the 3s/10s yield spread often heads toward zero as money supply growth moves in the same direction. This was especially clear from 1999 through 2000, from 2004 to 2006, and during 2018 and 2019, and beginning in 2022.
This all points toward rapidly declining economic activity in an economy where real savings and investments have been hollowed out by more than a decade of easy money. Without an economy geared toward real savings and increased productivity, ongoing monetary inflation will increasingly make price inflation worse. In this fragile economy, the Fed has therefore had to choose between rising price inflation on the one hand, and a banking system teetering on the brink in the other. Inflation fears have—for now—spurred the Fed to allow interest rates to rise, accompanied by a contracting money supply.
It remains to be seen how long it will take the Fed to hit the panic button and retreat back toward easy money, spurring a continuation of this cycle of mounting price inflation.
Authored by Ryan McMaken via The Mises Institute,
Money supply growth fell again in February, falling even further into negative territory after turning negative in November 2022 for the first time in twenty-eight years. February’s drop continues a steep downward trend from the unprecedented highs experienced during much of the past two years.
Since April 2021, money supply growth has slowed quickly, and since November, we’ve been seeing the money supply contract for the first time since the 1990s. The last time the year-over-year (YOY) change in the money supply slipped into negative territory was in November 1994. At that time, negative growth continued for fifteen months, finally turning positive again in January 1996.
During February 2023, the downturn became even bigger as YOY growth in the money supply was at –6.6 percent. That’s down from January’s rate of –5.0 percent, and down from February 2022’s rate of 6.9 percent. With negative growth now dipping below –6 percent, money-supply contraction is approaching the biggest declines we’ve seen in decades. At no point for at least sixty years has the money supply fallen by more than 5.6 percent in any month.
The money supply metric used here—the “true,” or Rothbard-Salerno, money supply measure (TMS)—is the metric developed by Murray Rothbard and Joseph Salerno, and is designed to provide a better measure of money supply fluctuations than M2.
The Mises Institute now offers regular updates on this metric and its growth. This measure of the money supply differs from M2 in that it includes Treasury deposits at the Fed (and excludes short-time deposits and retail money funds).
In recent months, M2 growth rates have followed a similar course to TMS growth rates, although TMS has fallen faster than M2. In February 2023, the M2 growth rate was –2.2 percent. That’s down from January’s growth rate of –1.7 percent. February’s rate was also well down from February 2022’s rate of 10.5 percent.
Money supply growth can often be a helpful measure of economic activity and an indicator of coming recessions. During periods of economic boom, money supply tends to grow quickly as commercial banks make more loans. Recessions, on the other hand, tend to be preceded by slowing rates of money supply growth.
Negative money supply growth is not in itself an especially meaningful metric. But the drop into negative territory we’ve seen in recent months does help illustrate just how far and how rapidly money supply growth has fallen. That is generally a red flag for economic growth and employment.
The fact that the money supply is shrinking at all is so remarkable because the money supply almost never gets smaller. The money supply has now fallen by $1.7 trillion (or eight percent) since the peak in April 2022. In raw numbers, that’s certainly the largest fall we’ve seen. But we can see in the next graph why, in percentage terms, the drop doesn’t beat those of the late 80s and early 90s. Money creation since 2009—and especially since 2020—has been so large that even a drop of $1 trillion is relatively small in percentage terms. Rather, the money supply would have to drop another $5 trillion or so—or more than 25 percent—just to return to the pre-2009 trend.
In fact, since 2009, the TMS money supply has grown by 200 percent. (M2 has grown by 149 percent in that period.) Out of the current money supply of $20 trillion, $5.8 trillion of that has been created since January 2020—or 28 percent. Since 2009, $13.4 trillion of the current money supply has been created. In other words, nearly two-thirds of the money supply have been created over the past thirteen years.
With these kinds of totals, an eight-percent drop puts a fairly small dent in the huge edifice of newly created money. The US economy still faces a very large monetary overhang from the past several years, and this is partly why after nine months of slowing money-supply growth, we are not yet seeing a sizable slowdown in the labor market.
Nonetheless, the monetary slowdown has been sufficient to considerably weaken the economy. Home prices have fallen. Credit card debt has soared, consumer loan delinquencies are up, job openings are falling, and the manufacturing outlook is falling.
We’ve seen these trends continue in March of this year as well. In March, growth in consumer loans fell almost to zero.
Money Supply and Rising Interest Rates
Not surprisingly, this comes after the Federal Reserve finally pulled its foot slightly off the money-creation accelerator after more than a decade of quantitative easing, financial repression, and a general devotion to easy money. The Fed has allowed the federal funds rate to rise to five percent. This has also meant short-term interest rates overall have risen as well. In March, for example, the yield on 3-month Treasurys is approaching the highest level measured in 16 years.
This means trouble for all the zombie companies and banks that have become heavily dependent on easy money. As explained by Daniel Lacalle, the long period of easy money ended up getting banks heavily dependent on low-interest longer-term Treasury and mortgage-backed securities. Now mounting price inflation has forced the Fed to allow interest rates to rise slightly, however. Now, banks find they don’t have enough interest income coming in—i.e., income from those older low-interest securities—to pay the bank’s bills in the current era of higher interest rates. The first problem signs of this yield mismatch have appeared with the failures of Silicon Valley Bank and Signature Bank.
Banks are therefore reluctant to raise interest rates on deposits, and this has led to a historic decline in bank deposits with March deposits falling deeper into negative territory than in any other month in more than 50 years.
This is all connected to falling money-supply growth, as well. As Bob Murphy notes in his book Understanding Money Mechanics, a sustained decline in TMS growth often reflects spikes in short-term yields, which can fuel a flattening or inverting yield curve—which strongly suggests a recession is approaching. For example, the 3s/10s yield spread often heads toward zero as money supply growth moves in the same direction. This was especially clear from 1999 through 2000, from 2004 to 2006, and during 2018 and 2019, and beginning in 2022.
This all points toward rapidly declining economic activity in an economy where real savings and investments have been hollowed out by more than a decade of easy money. Without an economy geared toward real savings and increased productivity, ongoing monetary inflation will increasingly make price inflation worse. In this fragile economy, the Fed has therefore had to choose between rising price inflation on the one hand, and a banking system teetering on the brink in the other. Inflation fears have—for now—spurred the Fed to allow interest rates to rise, accompanied by a contracting money supply.
It remains to be seen how long it will take the Fed to hit the panic button and retreat back toward easy money, spurring a continuation of this cycle of mounting price inflation.
Loading…
