Readers will recall that according to Jerome Powell's own presser, the Fed's first 75bps rate hike in more than two decades was erroneously prompted by an abnormally higher preliminary UMich 5-10 year inflation print (which was subsequently revised lower in the final number). Well, if the Fed is so data-dependent that it now react to preliminary econ data prints, then the latest data out of the NY Fed's monthly Consumer Expectations survey would suggest a rate cut may be on deck.
SURVEY OF CONSUMER EXPECTATIONS
— NY Fed Research (@NYFedResearch) August 8, 2022
Median one- and three-year-ahead inflation expectations both declined sharply in July, to 6.2% and 3.2% from 6.8% and 3.6% in June, respectively. https://t.co/22YzFj6qgF pic.twitter.com/ZVsjZTdSSA
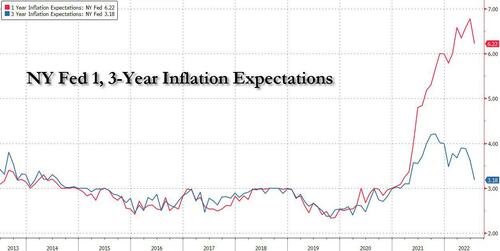
Today at 11am ET, the NY Fed released its latest Consumer Expectations survey which showed a record drop in short-, medium- and longer-term inflation expectations: specifically, inflation expectations at the 1-year horizon decreased to 6.22% in July - the lowest since February - from the previous month’s 6.78%, the biggest monthly drop on record as expectations about year-ahead price increases for gas and food fell sharply. At the same time, median three-year-ahead inflation expectations also declined, from 3.62% to 3.18%, lowest since April 2021.
"Both decreases were broad based across income groups, but largest among respondents with annual household incomes under $50k and respondents with no more than a high school education," the report noted.
Finally, the median five-year ahead inflation expectations, surveyed intermittently since the beginning of this year, fell from 2.8% to 2.3%. After being stable at 3.0% during the first three months of the year, the series has been trending down since. Disagreement across respondents in their five-year ahead inflation expectations remained unchanged in July.
The Median inflation uncertainty—or the uncertainty expressed regarding future inflation outcomes—declined slightly at both the one- and three-year-ahead horizons. Uncertainty at the five-year-ahead horizon decreased more substantially.
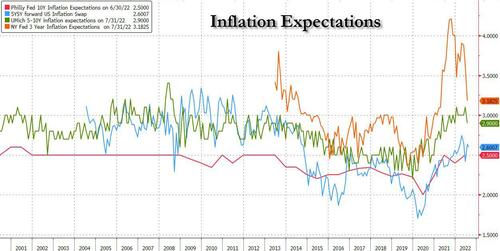
Putting the move in context, while the NY Fed's 3 Year inflation expectations overshot most other forward inflation trackers, it also has tumbled the most in recent months.
Separately, home price growth expectations and year-ahead spending growth expectations continued to pull back from recent series highs. Households’ income growth expectations improved. Some more details:
- Median expected change in home prices one year from now fell to 3.46% from 4.38%, its third consecutive decrease and its lowest reading of the series since November 2020. The decline was broad based across education and income groups and across census regions, but was largest in the Northeast census region.
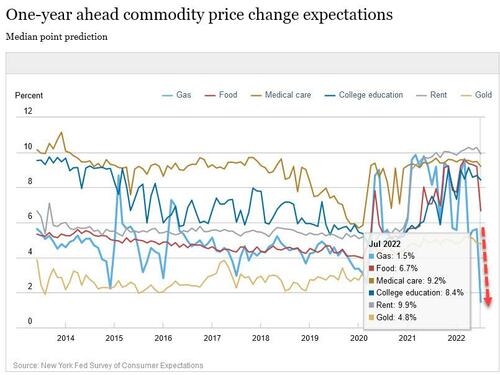
- Decrease in expected gas price growth second largest on record in available data going back to 2013; decline in food price growth expectations largest since series began; Over the next year consumers expect gasoline prices to rise 1.46%; food prices to rise 6.66%; medical costs to rise 9.2%; the price of a college education to rise 8.43%; rent prices to rise 9.91%
- Expectations about year-ahead price changes decreased sharply by 4.2 percentage points for gas (to 1.5%) and by 2.5 percentage points for food (to 6.7%). The decrease in expected gas price growth was the second largest in the series, just below the 4.5 percentage point decline in April of this year. The decline in food price growth expectations was the largest observed since the beginning of the series in June 2013. There were smaller declines in expectations about year-ahead changes in rent (from 10.3% to 9.9%), medical care (from 9.5% to 9.2%), and college education (from 8.7% to 8.4%).
The red arrow on the chart below shows just how remarkable the collapse in gas price expectations is: while we are confident the survey organizers phrased this question on purpose in a way to make the Biden admin look good, we doubt they expected that the result would be respondents calling for a mid-2023 depression!
Aside from inflation, survey respondents had the following expectations about the...
Labor market:
- Median one-year-ahead expected earnings growth remained unchanged at 3.0% in July for the seventh consecutive month.
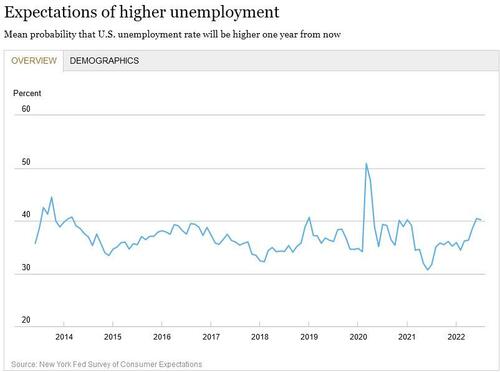
- Mean unemployment expectations—or the mean probability that the U.S. unemployment rate will be higher one year from now—decreased by 0.2 percentage point to 40.2%.
- The mean perceived probability of losing one’s job in the next 12 months declined slightly to 11.8% from 11.9%, remaining well below its pre-pandemic reading of 13.8% in February 2020. The mean probability of leaving one’s job voluntarily in the next 12 months rose to 19.5% from 18.6% in June. The series has moved within a narrow 18.6% to 20.4% range over the past year.
- The mean perceived probability of finding a job in the next three months (if one’s current job was lost) declined to 55.9% from 56.8%, moving slightly below its trailing 12-month average of 56.5%.
A quick aside here to point out just how ludicrous the survey now is thanks to today's responses which on one hand see a collapse in inflation expectations... and also at the same time the majority sees the unemployment rate dropping from here to new all time lows (as just 40% see higher unemployment).
Yes, we know that survey respondents don't really do Econ 101, but one would at least have hoped that the survey organizers would avoid a situation where they have two mutually impossible outcomes!
Household Finance
- The median expected growth in household income increased by 0.2 percentage point in July to 3.4%, a new series high. The increase was most pronounced for respondents without a college education and with lower (below $50k) annual household incomes.
- Median year-ahead nominal household spending growth expectations fell by 1.5 percentage points to 6.9% in July, well below its series high of 9.0% in May, but remains above its trailing 12-month average of 6.4%. The decline, the largest in this series, was broad-based across age, education, and income groups.
- Perceptions of credit access compared to a year ago continued to deteriorate in July, with the share of respondents finding it harder to obtain credit now than a year ago reaching a series high. Expectations about future credit availability improved slightly.
- The average perceived probability of missing a minimum debt payment over the next three months decreased by 0.5 percentage point to 10.8%, remaining below its pre-pandemic level of 11.4% in February 2020.
- The median expectation regarding a year-ahead change in taxes (at current income level) increased by 0.4 percentage point to 4.9%.
- Median year-ahead expected growth in government debt decreased by 0.4 percentage point to 10.7%.
- The mean perceived probability that the average interest rate on saving accounts will be higher 12 months from now decreased to 34.1% from 35.7%.
- Perceptions about households’ current financial situations compared to a year ago improved slightly in July, with slightly fewer respondents reporting being financially worse off than they were a year ago. Respondents were also more optimistic about their household’s financial situation in the year ahead, with fewer respondents expecting their financial situation to deteriorate a year from now.
- The mean perceived probability that U.S. stock prices will be higher 12 months from now increased to 34.3% from 33.8%.
In summary, while this survey clearly is meant to serve political means (i.e., collapsing gas price expectations), it fails to be even remotely coherent, with most respondents expecting unemployment to fall further. Newsflash: that means no recession, it also means gas prices soar from here.
But since we doubt anyone except us will have read the fine print of the survey, the media will be happy to pump the headline that "inflation expectations" are collapsing for one simple reason: it makes both Biden and the Fed look good. As for the final outcome of current fiscal and monetary policies, let's just check back in one year and see where inflation truly is in the summer of 2023.
More in the full NY Fed report here.
Readers will recall that according to Jerome Powell’s own presser, the Fed’s first 75bps rate hike in more than two decades was erroneously prompted by an abnormally higher preliminary UMich 5-10 year inflation print (which was subsequently revised lower in the final number). Well, if the Fed is so data-dependent that it now react to preliminary econ data prints, then the latest data out of the NY Fed’s monthly Consumer Expectations survey would suggest a rate cut may be on deck.
SURVEY OF CONSUMER EXPECTATIONS
Median one- and three-year-ahead inflation expectations both declined sharply in July, to 6.2% and 3.2% from 6.8% and 3.6% in June, respectively. https://t.co/22YzFj6qgF pic.twitter.com/ZVsjZTdSSA
— NY Fed Research (@NYFedResearch) August 8, 2022
Today at 11am ET, the NY Fed released its latest Consumer Expectations survey which showed a record drop in short-, medium- and longer-term inflation expectations: specifically, inflation expectations at the 1-year horizon decreased to 6.22% in July – the lowest since February – from the previous month’s 6.78%, the biggest monthly drop on record as expectations about year-ahead price increases for gas and food fell sharply. At the same time, median three-year-ahead inflation expectations also declined, from 3.62% to 3.18%, lowest since April 2021.
“Both decreases were broad based across income groups, but largest among respondents with annual household incomes under $50k and respondents with no more than a high school education,” the report noted.
Finally, the median five-year ahead inflation expectations, surveyed intermittently since the beginning of this year, fell from 2.8% to 2.3%. After being stable at 3.0% during the first three months of the year, the series has been trending down since. Disagreement across respondents in their five-year ahead inflation expectations remained unchanged in July.
The Median inflation uncertainty—or the uncertainty expressed regarding future inflation outcomes—declined slightly at both the one- and three-year-ahead horizons. Uncertainty at the five-year-ahead horizon decreased more substantially.
Putting the move in context, while the NY Fed’s 3 Year inflation expectations overshot most other forward inflation trackers, it also has tumbled the most in recent months.
Separately, home price growth expectations and year-ahead spending growth expectations continued to pull back from recent series highs. Households’ income growth expectations improved. Some more details:
- Median expected change in home prices one year from now fell to 3.46% from 4.38%, its third consecutive decrease and its lowest reading of the series since November 2020. The decline was broad based across education and income groups and across census regions, but was largest in the Northeast census region.
- Decrease in expected gas price growth second largest on record in available data going back to 2013; decline in food price growth expectations largest since series began; Over the next year consumers expect gasoline prices to rise 1.46%; food prices to rise 6.66%; medical costs to rise 9.2%; the price of a college education to rise 8.43%; rent prices to rise 9.91%
- Expectations about year-ahead price changes decreased sharply by 4.2 percentage points for gas (to 1.5%) and by 2.5 percentage points for food (to 6.7%). The decrease in expected gas price growth was the second largest in the series, just below the 4.5 percentage point decline in April of this year. The decline in food price growth expectations was the largest observed since the beginning of the series in June 2013. There were smaller declines in expectations about year-ahead changes in rent (from 10.3% to 9.9%), medical care (from 9.5% to 9.2%), and college education (from 8.7% to 8.4%).
The red arrow on the chart below shows just how remarkable the collapse in gas price expectations is: while we are confident the survey organizers phrased this question on purpose in a way to make the Biden admin look good, we doubt they expected that the result would be respondents calling for a mid-2023 depression!
Aside from inflation, survey respondents had the following expectations about the…
Labor market:
- Median one-year-ahead expected earnings growth remained unchanged at 3.0% in July for the seventh consecutive month.
- Mean unemployment expectations—or the mean probability that the U.S. unemployment rate will be higher one year from now—decreased by 0.2 percentage point to 40.2%.
- The mean perceived probability of losing one’s job in the next 12 months declined slightly to 11.8% from 11.9%, remaining well below its pre-pandemic reading of 13.8% in February 2020. The mean probability of leaving one’s job voluntarily in the next 12 months rose to 19.5% from 18.6% in June. The series has moved within a narrow 18.6% to 20.4% range over the past year.
- The mean perceived probability of finding a job in the next three months (if one’s current job was lost) declined to 55.9% from 56.8%, moving slightly below its trailing 12-month average of 56.5%.
A quick aside here to point out just how ludicrous the survey now is thanks to today’s responses which on one hand see a collapse in inflation expectations… and also at the same time the majority sees the unemployment rate dropping from here to new all time lows (as just 40% see higher unemployment).
Yes, we know that survey respondents don’t really do Econ 101, but one would at least have hoped that the survey organizers would avoid a situation where they have two mutually impossible outcomes!
Household Finance
- The median expected growth in household income increased by 0.2 percentage point in July to 3.4%, a new series high. The increase was most pronounced for respondents without a college education and with lower (below $50k) annual household incomes.
- Median year-ahead nominal household spending growth expectations fell by 1.5 percentage points to 6.9% in July, well below its series high of 9.0% in May, but remains above its trailing 12-month average of 6.4%. The decline, the largest in this series, was broad-based across age, education, and income groups.
- Perceptions of credit access compared to a year ago continued to deteriorate in July, with the share of respondents finding it harder to obtain credit now than a year ago reaching a series high. Expectations about future credit availability improved slightly.
- The average perceived probability of missing a minimum debt payment over the next three months decreased by 0.5 percentage point to 10.8%, remaining below its pre-pandemic level of 11.4% in February 2020.
- The median expectation regarding a year-ahead change in taxes (at current income level) increased by 0.4 percentage point to 4.9%.
- Median year-ahead expected growth in government debt decreased by 0.4 percentage point to 10.7%.
- The mean perceived probability that the average interest rate on saving accounts will be higher 12 months from now decreased to 34.1% from 35.7%.
- Perceptions about households’ current financial situations compared to a year ago improved slightly in July, with slightly fewer respondents reporting being financially worse off than they were a year ago. Respondents were also more optimistic about their household’s financial situation in the year ahead, with fewer respondents expecting their financial situation to deteriorate a year from now.
- The mean perceived probability that U.S. stock prices will be higher 12 months from now increased to 34.3% from 33.8%.
In summary, while this survey clearly is meant to serve political means (i.e., collapsing gas price expectations), it fails to be even remotely coherent, with most respondents expecting unemployment to fall further. Newsflash: that means no recession, it also means gas prices soar from here.
But since we doubt anyone except us will have read the fine print of the survey, the media will be happy to pump the headline that “inflation expectations” are collapsing for one simple reason: it makes both Biden and the Fed look good. As for the final outcome of current fiscal and monetary policies, let’s just check back in one year and see where inflation truly is in the summer of 2023.
More in the full NY Fed report here.
