Every four years the Summer Olympics come around and athletes vie for medals, sporting glory, and the success of their country.
Athletes in peak condition stun crowds, create new records, and push the limits of the human body. And over time, those bodies have gotten noticeably bigger.
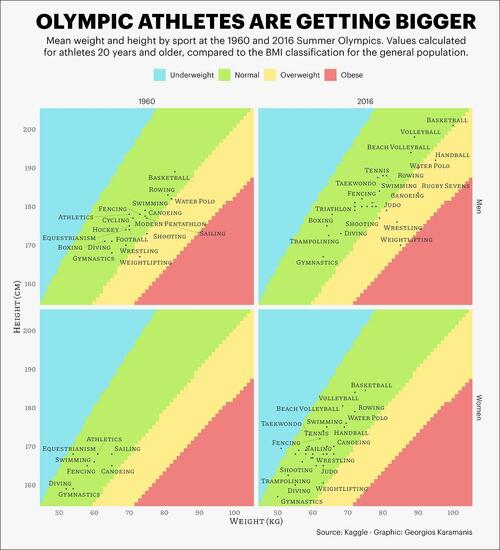
Using data from Sports Reference (via Kaggle), Visual Capitalist's Georgios Karamanis plotted the average height and weight of Olympic athletes by sport to show how their body dimensions have changed over the years.
Sports Where Olympic Athletes are Getting Bigger
At first glance, all sports seemed to have moved to the right and ascended up the chart (a higher average weight and height) over the last 50 years.
Here’s a table of the average weight of male Olympians, in kilograms, categorized by sport. Only sports where a direct comparison could be made between 1960 and 2016 were included:
| Sport | 1960 (Kg) | 2016 (Kg) | % Change |
|---|---|---|---|
| Athletics | 72.4 | 74.6 | +3.04% |
| Basketball | 83.9 | 100.2 | +19.43% |
| Boxing | 65.9 | 67.8 | +2.88% |
| Canoeing | 75.1 | 82.8 | +10.25% |
| Cycling | 69.9 | 73.6 | +5.29% |
| Diving | 66.2 | 66.9 | +1.06% |
| Equestrianism | 68.5 | 73.4 | +7.15% |
| Fencing | 72.5 | 79.5 | +9.66% |
| Football | 70.2 | 74.1 | +5.56% |
| Gymnastics | 65.1 | 63.1 | -3.07% |
| Hockey | 69.8 | 77.3 | +10.74% |
| Modern Pentathlon | 71.0 | 74.2 | +4.51% |
| Rowing | 79.2 | 86.7 | +9.47% |
| Sailing | 76.6 | 77.3 | +0.91% |
| Shooting | 75.8 | 80.2 | +5.80% |
| Swimming | 75.2 | 81.3 | +8.11% |
| Water Polo | 82.4 | 94.6 | +14.81% |
| Weightlifting | 76.3 | 87.8 | +15.07% |
| Wrestling | 72.2 | 85.9 | +18.98% |
The biggest example of the phenomenon is in basketball, where the average weight for men has gone up by more than 16 kilograms (35 lbs). The average height has also increased by 12 centimeters (5 in) as seen in the next table.
| Sport | 1960 (Cm) | 2016 (Cm) | % Change |
|---|---|---|---|
| Athletics | 178.40 | 181.00 | +1.46% |
| Basketball | 188.20 | 200.50 | +6.54% |
| Boxing | 171.50 | 175.60 | +2.39% |
| Canoeing | 177.50 | 182.40 | +2.76% |
| Cycling | 174.70 | 179.60 | +2.80% |
| Diving | 170.60 | 172.20 | +0.94% |
| Equestrianism | 174.10 | 179.50 | +3.10% |
| Fencing | 177.30 | 183.90 | +3.72% |
| Football (Soccer) | 174.10 | 179.60 | +3.16% |
| Gymnastics | 168.70 | 167.40 | -0.77% |
| Hockey | 174.50 | 179.90 | +3.09% |
| Modern Pentathlon | 176.80 | 182.80 | +3.39% |
| Rowing | 182.70 | 189.90 | +3.94% |
| Sailing | 176.60 | 181.30 | +2.66% |
| Shooting | 173.90 | 177.80 | +2.24% |
| Swimming | 179.30 | 187.60 | +4.63% |
| Water Polo | 182.00 | 191.20 | +5.05% |
| Weightlifting | 167.90 | 170.80 | +1.73% |
| Wrestling | 171.20 | 176.10 | +2.86% |
Wrestling, weightlifting, and water polo have also seen significant increases in weight and height for men. Under the Body Mass Index (BMI), all three have pushed clearly into overweight classification, with weightlifting especially close to obese.
On the women’s side, though more sports have been included in the Olympics since 1960, the sport-by-sport differences in average weight and height are less meteoric. Swimming, canoeing and diving saw the most change, though all three still fall well within normal BMI classification.
Does that mean athletes are becoming unhealthier? Not necessarily. Muscular athletes often have a high BMI because the index doesn’t differentiate between weight from fat, muscle, or bone. BMI also tends to exaggerate obesity in tall people, and thin-ness in short people.
The Outliers
Again, though most sports have seen athletes get bigger over time, there are some outliers.
Notably, gymnastics bucks the trend for both men and women in the chart. The average gymnast in 2016 was both lighter and shorter than their counterparts in 1960. Women gymnasts in particular weighed 4 kilograms (9 lbs) less and were nearly 3 centimeters (1 in) shorter.
Here’s a table of all the changes in weight for female Olympians:
| Sport | 1960 (Kg) | 2016 (Kg) | % Change |
|---|---|---|---|
| Athletics | 63.2 | 60.0 | -5.06% |
| Canoeing | 63.4 | 66.8 | +5.36% |
| Diving | 52.9 | 55.1 | +4.16% |
| Equestrianism | 57.2 | 58.6 | +2.45% |
| Fencing | 58.7 | 63.5 | +8.18% |
| Gymnastics | 54.1 | 49.7 | -8.13% |
| Sailing | 65.0 | 63.1 | -2.92% |
| Swimming | 60.3 | 63.9 | +5.97% |
In gymnastics, studies have shown that “smaller gymnasts with a high strength-to-mass ratio” have greater potential for performing rotations. One notable example is American gymnast Simone Biles, the most decorated gymnast in history, who measures 142 centimeters (4’8″) or a full 14 centimeters shorter than the average female gymnast at the 2016 Olympic games.
Here’s a table of the height changes for women Olympians.
| Sport | 1960 (Cm) | 2016 (Cm) | % Change |
|---|---|---|---|
| Athletics | 168.6 | 169.2 | +0.36% |
| Canoeing | 166.6 | 170.0 | +2.04% |
| Diving | 159.0 | 161.2 | +1.38% |
| Equestrianism | 167.0 | 168.2 | +0.72% |
| Fencing | 164.8 | 171.7 | +4.19% |
| Gymnastics | 159.2 | 156.4 | -1.76% |
| Sailing | 168.0 | 169.4 | +0.83% |
| Swimming | 165.9 | 174.2 | +5.00% |
Female Olympians also saw weight decreases in athletics and sailing, even as they logged height increases in the same sports.
However, as the Olympics have added and removed categories from the games over the years, several sports don’t have direct comparisons available. For women in particular, only eight categories of sport from the 1960s were still present in the Rio Olympics. For men, that number goes up to 19 sports.
We’ll have to wait for the next few Olympics to see if this trend continues or starts to plateau at an ideal height and weight combination for athletes competing at the highest levels of sport.
Every four years the Summer Olympics come around and athletes vie for medals, sporting glory, and the success of their country.
Athletes in peak condition stun crowds, create new records, and push the limits of the human body. And over time, those bodies have gotten noticeably bigger.
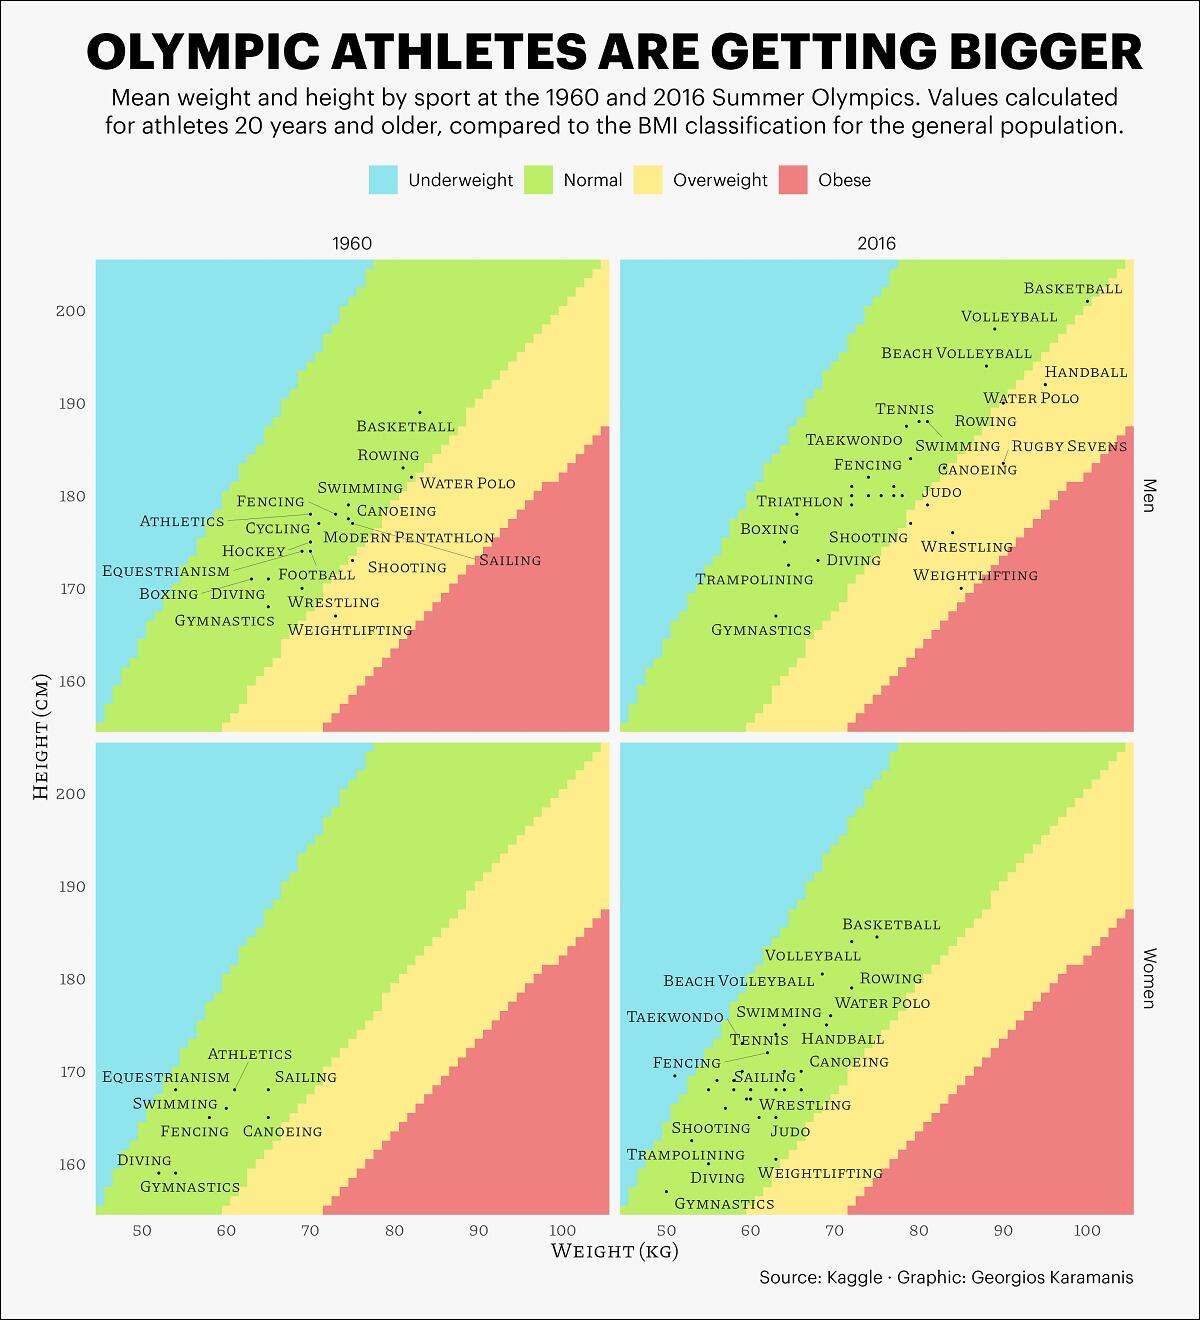
Using data from Sports Reference (via Kaggle), Visual Capitalist’s Georgios Karamanis plotted the average height and weight of Olympic athletes by sport to show how their body dimensions have changed over the years.

Sports Where Olympic Athletes are Getting Bigger
At first glance, all sports seemed to have moved to the right and ascended up the chart (a higher average weight and height) over the last 50 years.
Here’s a table of the average weight of male Olympians, in kilograms, categorized by sport. Only sports where a direct comparison could be made between 1960 and 2016 were included:
| Sport | 1960 (Kg) | 2016 (Kg) | % Change |
|---|---|---|---|
| Athletics | 72.4 | 74.6 | +3.04% |
| Basketball | 83.9 | 100.2 | +19.43% |
| Boxing | 65.9 | 67.8 | +2.88% |
| Canoeing | 75.1 | 82.8 | +10.25% |
| Cycling | 69.9 | 73.6 | +5.29% |
| Diving | 66.2 | 66.9 | +1.06% |
| Equestrianism | 68.5 | 73.4 | +7.15% |
| Fencing | 72.5 | 79.5 | +9.66% |
| Football | 70.2 | 74.1 | +5.56% |
| Gymnastics | 65.1 | 63.1 | -3.07% |
| Hockey | 69.8 | 77.3 | +10.74% |
| Modern Pentathlon | 71.0 | 74.2 | +4.51% |
| Rowing | 79.2 | 86.7 | +9.47% |
| Sailing | 76.6 | 77.3 | +0.91% |
| Shooting | 75.8 | 80.2 | +5.80% |
| Swimming | 75.2 | 81.3 | +8.11% |
| Water Polo | 82.4 | 94.6 | +14.81% |
| Weightlifting | 76.3 | 87.8 | +15.07% |
| Wrestling | 72.2 | 85.9 | +18.98% |
The biggest example of the phenomenon is in basketball, where the average weight for men has gone up by more than 16 kilograms (35 lbs). The average height has also increased by 12 centimeters (5 in) as seen in the next table.
| Sport | 1960 (Cm) | 2016 (Cm) | % Change |
|---|---|---|---|
| Athletics | 178.40 | 181.00 | +1.46% |
| Basketball | 188.20 | 200.50 | +6.54% |
| Boxing | 171.50 | 175.60 | +2.39% |
| Canoeing | 177.50 | 182.40 | +2.76% |
| Cycling | 174.70 | 179.60 | +2.80% |
| Diving | 170.60 | 172.20 | +0.94% |
| Equestrianism | 174.10 | 179.50 | +3.10% |
| Fencing | 177.30 | 183.90 | +3.72% |
| Football (Soccer) | 174.10 | 179.60 | +3.16% |
| Gymnastics | 168.70 | 167.40 | -0.77% |
| Hockey | 174.50 | 179.90 | +3.09% |
| Modern Pentathlon | 176.80 | 182.80 | +3.39% |
| Rowing | 182.70 | 189.90 | +3.94% |
| Sailing | 176.60 | 181.30 | +2.66% |
| Shooting | 173.90 | 177.80 | +2.24% |
| Swimming | 179.30 | 187.60 | +4.63% |
| Water Polo | 182.00 | 191.20 | +5.05% |
| Weightlifting | 167.90 | 170.80 | +1.73% |
| Wrestling | 171.20 | 176.10 | +2.86% |
Wrestling, weightlifting, and water polo have also seen significant increases in weight and height for men. Under the Body Mass Index (BMI), all three have pushed clearly into overweight classification, with weightlifting especially close to obese.
On the women’s side, though more sports have been included in the Olympics since 1960, the sport-by-sport differences in average weight and height are less meteoric. Swimming, canoeing and diving saw the most change, though all three still fall well within normal BMI classification.
Does that mean athletes are becoming unhealthier? Not necessarily. Muscular athletes often have a high BMI because the index doesn’t differentiate between weight from fat, muscle, or bone. BMI also tends to exaggerate obesity in tall people, and thin-ness in short people.
The Outliers
Again, though most sports have seen athletes get bigger over time, there are some outliers.
Notably, gymnastics bucks the trend for both men and women in the chart. The average gymnast in 2016 was both lighter and shorter than their counterparts in 1960. Women gymnasts in particular weighed 4 kilograms (9 lbs) less and were nearly 3 centimeters (1 in) shorter.
Here’s a table of all the changes in weight for female Olympians:
| Sport | 1960 (Kg) | 2016 (Kg) | % Change |
|---|---|---|---|
| Athletics | 63.2 | 60.0 | -5.06% |
| Canoeing | 63.4 | 66.8 | +5.36% |
| Diving | 52.9 | 55.1 | +4.16% |
| Equestrianism | 57.2 | 58.6 | +2.45% |
| Fencing | 58.7 | 63.5 | +8.18% |
| Gymnastics | 54.1 | 49.7 | -8.13% |
| Sailing | 65.0 | 63.1 | -2.92% |
| Swimming | 60.3 | 63.9 | +5.97% |
In gymnastics, studies have shown that “smaller gymnasts with a high strength-to-mass ratio” have greater potential for performing rotations. One notable example is American gymnast Simone Biles, the most decorated gymnast in history, who measures 142 centimeters (4’8″) or a full 14 centimeters shorter than the average female gymnast at the 2016 Olympic games.
Here’s a table of the height changes for women Olympians.
| Sport | 1960 (Cm) | 2016 (Cm) | % Change |
|---|---|---|---|
| Athletics | 168.6 | 169.2 | +0.36% |
| Canoeing | 166.6 | 170.0 | +2.04% |
| Diving | 159.0 | 161.2 | +1.38% |
| Equestrianism | 167.0 | 168.2 | +0.72% |
| Fencing | 164.8 | 171.7 | +4.19% |
| Gymnastics | 159.2 | 156.4 | -1.76% |
| Sailing | 168.0 | 169.4 | +0.83% |
| Swimming | 165.9 | 174.2 | +5.00% |
Female Olympians also saw weight decreases in athletics and sailing, even as they logged height increases in the same sports.
However, as the Olympics have added and removed categories from the games over the years, several sports don’t have direct comparisons available. For women in particular, only eight categories of sport from the 1960s were still present in the Rio Olympics. For men, that number goes up to 19 sports.
We’ll have to wait for the next few Olympics to see if this trend continues or starts to plateau at an ideal height and weight combination for athletes competing at the highest levels of sport.
Loading…