Authored by Michael Lebowitz via RealInvestmentAdvice.com,
In Goodbye TINA, Hello BAAA, we make a case that investors should expect better total returns from bonds versus stocks over the next ten years. To be clear, we do not think investors should ditch stocks and only hold bonds. But if we are correct and bonds generally outperform stocks, picking the right stocks instead of the most popular ones may be more rewarding than investors have grown accustomed to.
The overwhelming popularity of passive investment strategies has dramatically diminished the value of stock picking. Instead of actively picking stocks offering the most value, unique fundamental traits, or the right industry, passive investors have been rewarded for picking the top dozen or so stocks in the most popular stock ETFs. As we potentially enter a period of low expected stock returns, passive investing may be less appealing. It has been a while, but once again, the art of stock picking may be of value.
In this article, we look back to other periods where bonds outperformed stocks. This analysis allows us to assess specific stock traits and specific industries that over- and underperformed in prior BAAA (Bonds Are An Alternative) eras.
Welcome Fixed Income
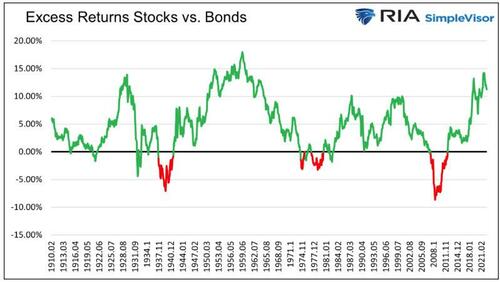
The graph below shows the cyclicality of monthly ten-year excess total returns for stocks versus bonds.
Our methodology to calculate total returns assumes we buy and hold the S&P 500 for ten years and a ten-year UST bond until maturity. As such, there are no price gains or losses on the bond.
We highlight in red the recurring ten-year periods where bonds outperformed stocks. The date and excess return figures on the graph are for the ten-year periods ending on that date. For example, the excess return figure for June 1974 is based on the period from June 1964 to June 1974.
We do not have access to the equity data required to evaluate which types of stocks outperformed in the first red instance covering the later 1930s and early 1940s. As such, we only perform our analysis on the three ten-year periods ending in 1975, 1980, and 2012.
The data and industry classifications are courtesy of Kenneth R. French. His database provides monthly stock returns broken down into deciles for many variables.
Kenneth French is best known for his work in which he debunks the Capital Asset Pricing Model (CAPM). French and his partner Eugene Fama rightly claim that beta, or the market, isn’t the sole factor explaining stock returns. Their theory promotes active, not passive investing strategies.
Equity Factors
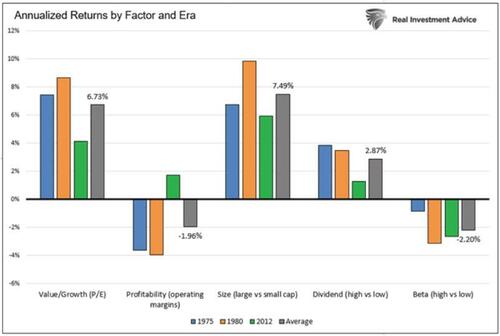
Our first set of analyses focuses on stock factors. Factors classify stocks by certain traits. Examples include size, dividend, and earnings quality. Our analysis looks at returns for the top and bottom 20% of stocks per factor category. We consider the following factors: value/growth, dividends, size, beta, and operating margins.
The excess returns were consistent across the three time periods despite a long gap between the most recent and prior periods. The figures represent the excess annualized total returns of the top 20% versus the bottom 20% of holdings per factor. For instance, the top 20% of stocks sorted by price to earnings (value) beat the 20% most expensive stocks by 6.73% annually on average.
As we share, investors choosing large cap and value stocks versus smaller cap and growth stocks picked up 6-7% annually over the three periods. Higher dividend stocks outperformed lower dividend stocks by almost 3% annually on average. Since bond yields were attractive in the three periods, investors could earn a respectable income from bonds and were likely not as focused on stock dividends as they usually might be.
Lower beta stocks did better than higher beta stocks. Lower beta stocks are often value-oriented, so the results do not surprise us.
Stocks with lower operating margins did better than those with higher profitability. This is also likely due to their value orientation.
Equity Sectors
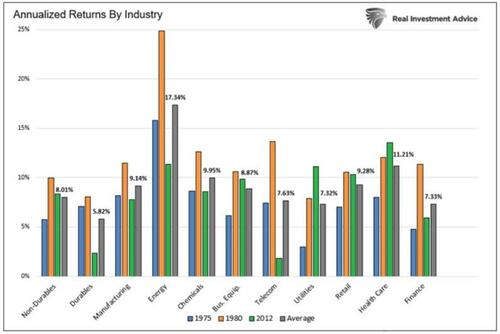
Next, we scan 11 industries to see which ones out and under-performed over the three periods. The industry classifications and data are also from Kenneth French. The average for the three periods is labeled.
Energy is the best-performing industry during periods when bonds provide better returns than stocks. Durables, while up on average 5.82% annually, are the worst performing.
The distinction seems to make sense as the higher inflationary environments are better for those mining or drilling and selling commodities versus those who must buy raw goods to assemble them.
Summary
Expected stock returns are on par with risk-free Treasury yields but woefully below the premium spread investors should demand. The simple conclusion is that for the entirety of the next ten years, bonds are the better bet. – Goodbye TINA, Hello BAAA
Since 1950 stock investors have earned an additional 5.53% for holding stocks versus bonds. In Goodbye TINA, Hello BAAA, we consider bonds the better bet because a 4% yield on a Treasury bond is on par with expected equity returns. Consider the 5.53% premium investors should demand and the case for bonds versus equities is a piece of cake.
Equities, even in a bond-friendly environment, are an essential part of a portfolio for diversification and risk management. While you may not hold as many stocks as a percentage in a bond-friendly climate, you may be well rewarded for pricking the right ones. Hopefully, this helps you consider what might be “right” in the coming years.


