Authored by Simon White, Bloomberg macro strategist,
Expectations of rate cuts in the US are liable to come unstuck as easing financial conditions raise the risk the Federal Reserve returns to the fold with another hike...
Be careful what you wish for.
The market’s increasing zeal for lower rates has rekindled the so-called everything rally. But if it persists it contains the seeds of its own destruction as it ultimately pushes the Fed to recommence raising rates, wrongfooting growing expectations of rate cuts, and leaves stocks and bonds prone to selling off.
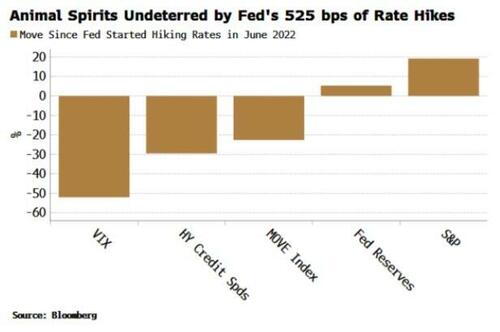
Since the Fed started tightening policy in June last year, the S&P is ~20% higher, credit spreads are tighter, implied equity and fixed-income volatility are lower and reserves have risen. Animal spirits have not exactly been deterred.
Central banks face the perennial problem of “time inconsistency”. This is the paradox that the optimal policy for a central bank at the current time may not be the optimal policy later. For instance, a central bank may promise in the future to raise rates to curb inflation. Market rates rise, conditions tighten, unemployment rises and inflation starts to fall. The bank is then in the position of having to raise rates when the labor market is weakening, or risk damaging its credibility.
Today, it may be optimal for the Fed to start countenancing rate cuts as it appears (to the Fed) that inflation is back under control. However, this blunts the totality of its policy rate’s impact across markets and the economy, raising the risk of a re-acceleration in inflation.
To see this, financial conditions are an obvious place to start.
The Fed has frequently cited them as one of the metrics it deems as important to gauge if policy is working.
“Key for policy is persistence of easing in financial conditions,” president of the New York Fed John Williams stated in a speech only last week.
Most indexes of financial conditions are composed of stock prices, implied volatility, credit spreads and credit standards.
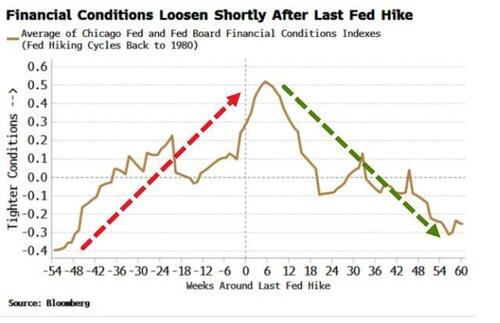
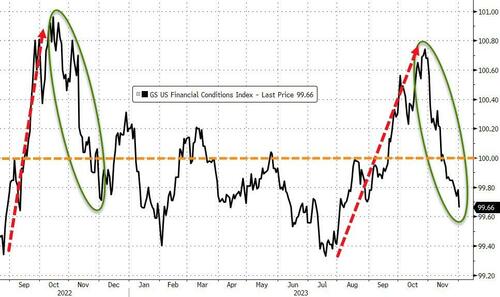
The rally this last month across assets has thus loosened financial conditions. This is actually quite normal after the Fed’s last hike, as can be seen in the chart below.
The key question is whether conditions will eventually ease enough to bring the Fed back to the table with another rise in rates?
Given generally still-favorable liquidity conditions that are supportive of risk assets, the odds are heading in that direction.
First, both prongs of Fed policy - quantitative tightening and the level of rates - are now tempering financial conditions rather than tightening them.
With QT, Fed reserves have been rising, despite the ongoing contraction in the Fed’s balance sheet. As discussed last week, November saw a jump in Fed reserves by ~$200 billion.
The dynamics of the Fed’s balance sheet - specifically money market funds drawing down on excess liquidity in the reverse repo facility (RRP) and the Treasury’s preference for issuing bills - have meant that reserves are being on net added to the system, supporting asset prices.
With the RRP still at ~$1.25 trillion and the next Quarterly Refunding Announcement — where the Treasury could indicate it is skewing issuance away from bills again — not until late January, there are no signs this supportive backdrop will alter in the near future (although we have seen a short-term dip in liquidity over the past week).
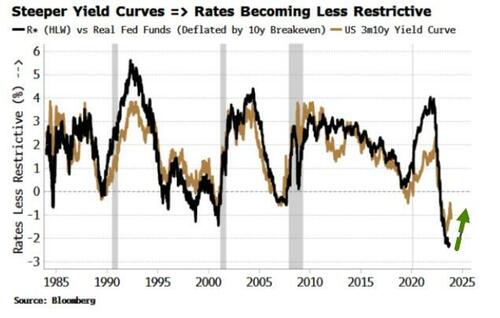
Also, the Fed’s policy rate is becoming less restrictive. The neutral rate, r*, is unobservable and estimates are released with a lag. But we can get a real-time indication of how restrictive the Fed’s rate is by looking at the yield curve. As the chart below shows, the difference between real fed funds and r* (i.e. the degree of restrictiveness in the rate) is analogous to the 3m versus 10y curve.
The steepening of the yield curve is telling us that even though the Fed has not yet cut the policy rate, it is nonetheless becoming less restrictive.
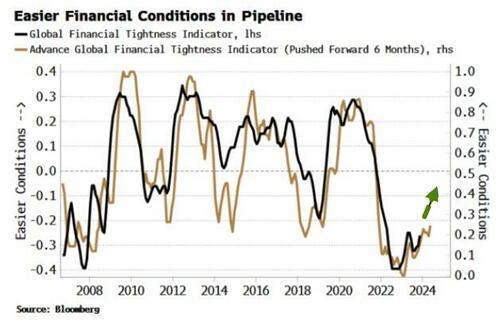
Global liquidity conditions are also easing, which will provide a further support to US assets, especially as the dollar continues to weaken. The Global Financial Tightness Indicator (GFTI) is a diffusion of central-bank rate hikes and has been rising - indicating easing conditions - as fewer central banks are hiking and some are cutting.
The Advanced Global Financial Tightness Index (the AGFTI; brown line in the chart below) uses central-bank rate expectations to lead the GFTI by about six months. As we can see, less hawkish central banks are boosting the AGFTI, pointing to the GFTI (black line in chart) continuing to rise also; i.e. financial conditions should keep easing.
Moreover, as discussed in last Tuesday’s column, excess liquidity also continues to rise, which is very supportive for risk assets over the medium term.
It’s been over four months since the Fed last hiked rates, and the market expects the next move to be a cut. History is on its side: it would be unprecedented for the Fed to re-start a hiking cycle after so long when rates are restrictive.
But not so if the rate is unrestrictive (i.e. it is less than r*), with the Fed recommencing hikes after a long pause on several occasions (1973, 1977, 2016 and 2017). The steepening of the yield curve or a re-rise in inflation (as I expect) would both indicate the Fed’s rate is losing its bite.
Liquidity conditions are such that risk assets keep can keep grinding higher, emboldening yet more speculative behavior antithetical to the desire to rein in animal spirits, increase risk premia and thus keep inflation contained.
The likelihood is rising the Fed – haunted by the ghost of Arthur Burns – will feel compelled to push against the market and raise rates again.
Authored by Simon White, Bloomberg macro strategist,
Expectations of rate cuts in the US are liable to come unstuck as easing financial conditions raise the risk the Federal Reserve returns to the fold with another hike…
Be careful what you wish for.
The market’s increasing zeal for lower rates has rekindled the so-called everything rally. But if it persists it contains the seeds of its own destruction as it ultimately pushes the Fed to recommence raising rates, wrongfooting growing expectations of rate cuts, and leaves stocks and bonds prone to selling off.
Since the Fed started tightening policy in June last year, the S&P is ~20% higher, credit spreads are tighter, implied equity and fixed-income volatility are lower and reserves have risen. Animal spirits have not exactly been deterred.
Central banks face the perennial problem of “time inconsistency”. This is the paradox that the optimal policy for a central bank at the current time may not be the optimal policy later. For instance, a central bank may promise in the future to raise rates to curb inflation. Market rates rise, conditions tighten, unemployment rises and inflation starts to fall. The bank is then in the position of having to raise rates when the labor market is weakening, or risk damaging its credibility.
Today, it may be optimal for the Fed to start countenancing rate cuts as it appears (to the Fed) that inflation is back under control. However, this blunts the totality of its policy rate’s impact across markets and the economy, raising the risk of a re-acceleration in inflation.
To see this, financial conditions are an obvious place to start.
The Fed has frequently cited them as one of the metrics it deems as important to gauge if policy is working.
“Key for policy is persistence of easing in financial conditions,” president of the New York Fed John Williams stated in a speech only last week.
Most indexes of financial conditions are composed of stock prices, implied volatility, credit spreads and credit standards.
The rally this last month across assets has thus loosened financial conditions. This is actually quite normal after the Fed’s last hike, as can be seen in the chart below.
The key question is whether conditions will eventually ease enough to bring the Fed back to the table with another rise in rates?
Given generally still-favorable liquidity conditions that are supportive of risk assets, the odds are heading in that direction.
First, both prongs of Fed policy – quantitative tightening and the level of rates – are now tempering financial conditions rather than tightening them.
With QT, Fed reserves have been rising, despite the ongoing contraction in the Fed’s balance sheet. As discussed last week, November saw a jump in Fed reserves by ~$200 billion.
The dynamics of the Fed’s balance sheet – specifically money market funds drawing down on excess liquidity in the reverse repo facility (RRP) and the Treasury’s preference for issuing bills – have meant that reserves are being on net added to the system, supporting asset prices.
With the RRP still at ~$1.25 trillion and the next Quarterly Refunding Announcement — where the Treasury could indicate it is skewing issuance away from bills again — not until late January, there are no signs this supportive backdrop will alter in the near future (although we have seen a short-term dip in liquidity over the past week).
Also, the Fed’s policy rate is becoming less restrictive. The neutral rate, r*, is unobservable and estimates are released with a lag. But we can get a real-time indication of how restrictive the Fed’s rate is by looking at the yield curve. As the chart below shows, the difference between real fed funds and r* (i.e. the degree of restrictiveness in the rate) is analogous to the 3m versus 10y curve.
The steepening of the yield curve is telling us that even though the Fed has not yet cut the policy rate, it is nonetheless becoming less restrictive.
Global liquidity conditions are also easing, which will provide a further support to US assets, especially as the dollar continues to weaken. The Global Financial Tightness Indicator (GFTI) is a diffusion of central-bank rate hikes and has been rising – indicating easing conditions – as fewer central banks are hiking and some are cutting.
The Advanced Global Financial Tightness Index (the AGFTI; brown line in the chart below) uses central-bank rate expectations to lead the GFTI by about six months. As we can see, less hawkish central banks are boosting the AGFTI, pointing to the GFTI (black line in chart) continuing to rise also; i.e. financial conditions should keep easing.
Moreover, as discussed in last Tuesday’s column, excess liquidity also continues to rise, which is very supportive for risk assets over the medium term.
It’s been over four months since the Fed last hiked rates, and the market expects the next move to be a cut. History is on its side: it would be unprecedented for the Fed to re-start a hiking cycle after so long when rates are restrictive.
But not so if the rate is unrestrictive (i.e. it is less than r*), with the Fed recommencing hikes after a long pause on several occasions (1973, 1977, 2016 and 2017). The steepening of the yield curve or a re-rise in inflation (as I expect) would both indicate the Fed’s rate is losing its bite.
Liquidity conditions are such that risk assets keep can keep grinding higher, emboldening yet more speculative behavior antithetical to the desire to rein in animal spirits, increase risk premia and thus keep inflation contained.
The likelihood is rising the Fed – haunted by the ghost of Arthur Burns – will feel compelled to push against the market and raise rates again.
Loading…
