Something very odd emerges for the second month in a row when looking at the July payrolls report.
Recall last month we showed that a stark divergence had opened between the Household and Establishment surveys that make up the monthly jobs report, and since March the former was sliding while the latter was rising every single month. In addition to that, full-time jobs were plunging while multiple jobholders soared near all time highs.
Guess what: at a time when the Biden admin is now being accused of fabricating energy numbers to push oil prices lower, the jarring divergences and inconsistencies in the jobs report just hit escape velocity.
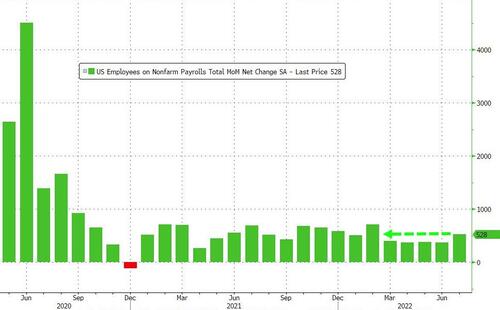
Consider the following: on one hand, the closely followed establishment survey came in red hot, and not only did it soar despite the US entering a technical recession last week, it printed at a 5 month high of 528K, a six-sigm beat to consensus expectations of 250K...
... and with wages also coming in hotter than expected, rising 0.5% M/M or 5.2% Y/Y, it was enough for many to conclude that calls of a recession are premature because, after all, you can't enter a recession when jobs are rising by over 500K.
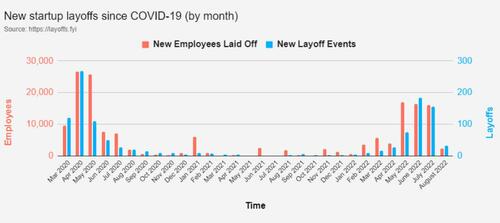
True... but a problem emerges for the second month in a row when looking at third-party data which tracks the number of new employees laid off as well as new layoff events, both of which have soared since May yet which have unexpectedly not been reflected in BLS data.
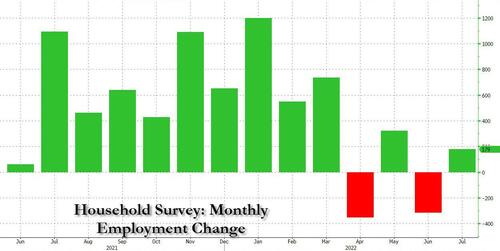
But even if one ignores outside data sources, a more pressing question emerges when looking at the BLS's own far more detailed, if less closely watched, Household survey. Here, unlike the Establishment Survey, the June jobs change was a far smaller 179K increase, following last month's 315K drop.
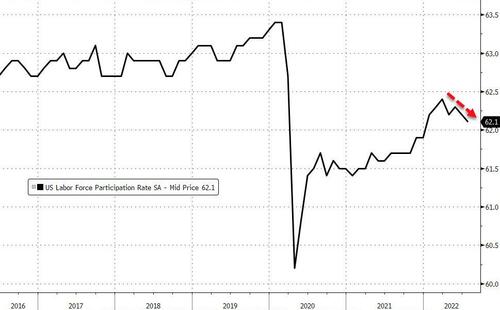
And since the Household survey also feeds other closely watched ratios, such as the labor force participation rate, it explains why despite the apparent "surge" in June jobs, the LFP declined for the second month in a row and is now back to levels last seen in 2021.
So what's going on here?
Well, those who read our article from last month will know what's coming next. Those who haven't, will be surprised to learn that something appears to have snapped a few months ago, around March, when the Establishment Survey kept on rising unperturbed, while the Household Survey hit some unexplained brick wall, and hasn't moved at all.
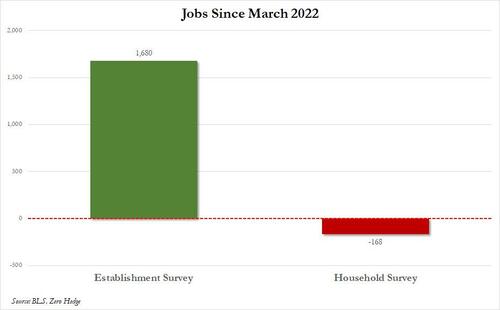
In fact, since March, the Establishment Survey shows a gain of 1.680 million jobs while the Household Survey shows an employment loss of 168K!
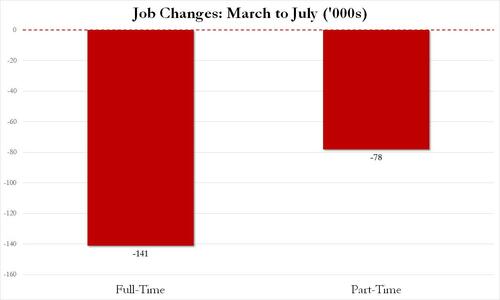
But wait, there's more, because digging in even deeper, we find that this drop in Household Survey employment is the result of both full-time and part-time jobs. In fact, as shown below, since March, the US has lost 141K full-time employees and 78K part-time employees.
This trend has persisted into June, when according to the BLS, the US labor force saw a 71K drop in full-time workers offset by a 384K gain in far lower paying part-timers (source). The offset? Multiple jobholders, or people who have more than one job.
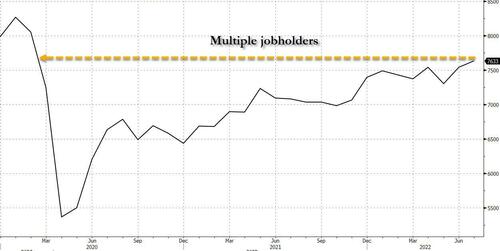
As shown below, while the number of total employees (per the Household Survey) has stagnated, the number of multiple jobholders has been growing steadily, hitting a new post-covid high in June of 7,541 million.
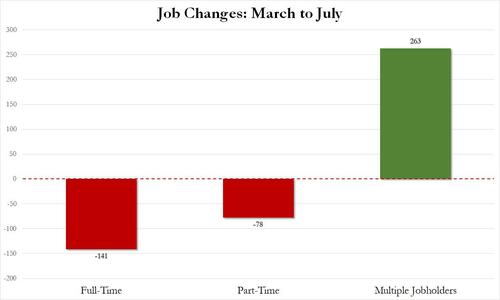
The increase for June? 92K, which stands in stark contrast to the sharp drop in full-time job holders. But even more notable is that since June, the US has lost 141K full-time jobs, 78K part-time jobs, while adding a whopping 263K multiple jobholders.
And even more remarkable: the number of multiple jobholders whose primary and secondary jobs are both full-time just hit a record high! Hardly the sign of a strong job market, one where people can afford to quit jobs at will.
So what's going on here? The simple answer: Fewer people working, but more people working more than one job, a rotation which picked up in earnest some time in March and which has only been captured by the Household survey.
And since the Establishment survey is far slower to pick up on the nuances in employment composition, while the Household Survey has gone nowhere since March, the BLS data engineers have been busy goalseeking the Establishment Survey (perhaps with the occasional nudge from the White House especially now that the economy is in a technical recession) to make it appear as if the economy is growing strongly, when in reality all they are doing is applying the same erroneous seasonal adjustment factor that gave such a wrong perspective of the labor market in the aftermath of the covid pandemic (until it was all adjusted away a year ago). In other words, while the labor market is already cracking, it will take the BLS several months of veering away from reality before the government bureaucrats accept and admit what is truly taking place.
We expect that "realization" to take place just after the midterms, because the last thing the Biden administration can afford is admit the labor market is crashing in addition to the continued surge in inflation.
Something very odd emerges for the second month in a row when looking at the July payrolls report.
Recall last month we showed that a stark divergence had opened between the Household and Establishment surveys that make up the monthly jobs report, and since March the former was sliding while the latter was rising every single month. In addition to that, full-time jobs were plunging while multiple jobholders soared near all time highs.
Guess what: at a time when the Biden admin is now being accused of fabricating energy numbers to push oil prices lower, the jarring divergences and inconsistencies in the jobs report just hit escape velocity.
Consider the following: on one hand, the closely followed establishment survey came in red hot, and not only did it soar despite the US entering a technical recession last week, it printed at a 5 month high of 528K, a six-sigm beat to consensus expectations of 250K…
… and with wages also coming in hotter than expected, rising 0.5% M/M or 5.2% Y/Y, it was enough for many to conclude that calls of a recession are premature because, after all, you can’t enter a recession when jobs are rising by over 500K.
True… but a problem emerges for the second month in a row when looking at third-party data which tracks the number of new employees laid off as well as new layoff events, both of which have soared since May yet which have unexpectedly not been reflected in BLS data.
But even if one ignores outside data sources, a more pressing question emerges when looking at the BLS’s own far more detailed, if less closely watched, Household survey. Here, unlike the Establishment Survey, the June jobs change was a far smaller 179K increase, following last month’s 315K drop.
And since the Household survey also feeds other closely watched ratios, such as the labor force participation rate, it explains why despite the apparent “surge” in June jobs, the LFP declined for the second month in a row and is now back to levels last seen in 2021.
So what’s going on here?
Well, those who read our article from last month will know what’s coming next. Those who haven’t, will be surprised to learn that something appears to have snapped a few months ago, around March, when the Establishment Survey kept on rising unperturbed, while the Household Survey hit some unexplained brick wall, and hasn’t moved at all.
In fact, since March, the Establishment Survey shows a gain of 1.680 million jobs while the Household Survey shows an employment loss of 168K!
But wait, there’s more, because digging in even deeper, we find that this drop in Household Survey employment is the result of both full-time and part-time jobs. In fact, as shown below, since March, the US has lost 141K full-time employees and 78K part-time employees.
This trend has persisted into June, when according to the BLS, the US labor force saw a 71K drop in full-time workers offset by a 384K gain in far lower paying part-timers (source). The offset? Multiple jobholders, or people who have more than one job.
As shown below, while the number of total employees (per the Household Survey) has stagnated, the number of multiple jobholders has been growing steadily, hitting a new post-covid high in June of 7,541 million.
The increase for June? 92K, which stands in stark contrast to the sharp drop in full-time job holders. But even more notable is that since June, the US has lost 141K full-time jobs, 78K part-time jobs, while adding a whopping 263K multiple jobholders.
And even more remarkable: the number of multiple jobholders whose primary and secondary jobs are both full-time just hit a record high! Hardly the sign of a strong job market, one where people can afford to quit jobs at will.
So what’s going on here? The simple answer: Fewer people working, but more people working more than one job, a rotation which picked up in earnest some time in March and which has only been captured by the Household survey.
And since the Establishment survey is far slower to pick up on the nuances in employment composition, while the Household Survey has gone nowhere since March, the BLS data engineers have been busy goalseeking the Establishment Survey (perhaps with the occasional nudge from the White House especially now that the economy is in a technical recession) to make it appear as if the economy is growing strongly, when in reality all they are doing is applying the same erroneous seasonal adjustment factor that gave such a wrong perspective of the labor market in the aftermath of the covid pandemic (until it was all adjusted away a year ago). In other words, while the labor market is already cracking, it will take the BLS several months of veering away from reality before the government bureaucrats accept and admit what is truly taking place.
We expect that “realization” to take place just after the midterms, because the last thing the Biden administration can afford is admit the labor market is crashing in addition to the continued surge in inflation.
