Authored by Mike Shedlock via MishTalk.com,
McKelvey-PMES Recession Indicator Weakens Slightly but Signal Still Firm
The McKelvey-PMES recession indicator dipped a bit in September but the signal still implies recession.
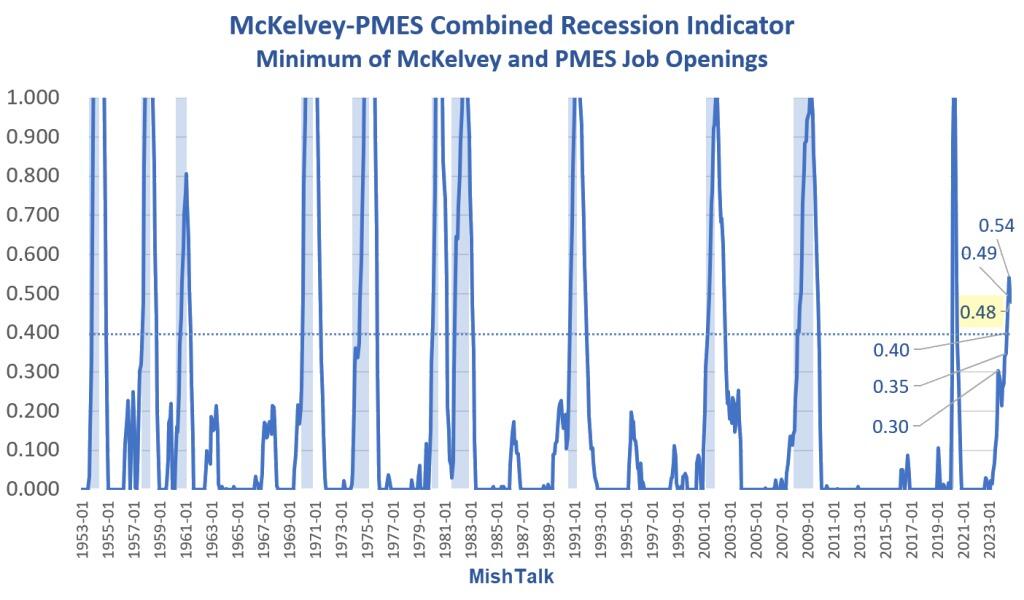
100 percent of the time, with no false positives or negatives, under current conditions, the economy has been in recession.
The odds are not 100 percent because the NBER sets recession dates, not these charts.
What is the McKelvey Recession Indicator?
Take the current value of the 3-month unemployment rate average, subtract the 12-month low, and if the difference is 0.30 percentage point or more, then a recession has started.
Edward McKelvey, a senior economist at Goldman Sachs, created the indicator.
The problem with the indicator is that it has many false positives.
Claudi Sahm Revision
Claudi Samn, a former Fed economist, revised the rule, claiming it as her own, without credit to McKelvey, then set the indicator to 0.50.
Because that still had false positives, she started her series in 1960.
PMES Acronym
PMES is my acronym for Pascal Michaillat and Emmanuel Saez, economists at the University of California in Santa Cruz.
PMES is their initials. I am not sure that PMES is right but somehow I don’t think the name McKelvey-Michaillat-Saez will catch on.
It is brilliant work to add a second indicator that eliminates the false negatives and false positives.
Credit goes to Regis Barnichon for the data and idea used by PMES and me in the charts in this post.
What Is the PMES Second Indicator?
The PMES recession indicator combines job vacancy rates with unemployment data. The indicator is the minimum of the McKelvey indicator—the difference between the 3-month trailing average of the unemployment rate and its minimum over the past 12 months—and a similar indicator constructed with the vacancy rate—the difference between the 3-month trailing average of the vacancy rate and its maximum over the past 12 months.
Vacancy Rate
The vacancy rate is defined as the ratio of job openings to the labor force. The BLS Job Openings and Labor Turnover (JOLTS) report only dates to December of 2000.
Regis Barnichon, in 2010 described Building a composite Help-Wanted Index
This paper builds a measure of vacancy posting over 1951–2009 that captures the behavior of total—print and online— help-wanted advertising, and can be used for time series analysis of the US labor market.
Barnichon says HWI and JOLTS “closely track each other. In particular, the composite HWI does a good job of matching the level of JOLTS job openings over 2000–2009, indicating that the MISM can successfully model the share of online advertising.“
It is that overlap period that validates the second indicator.
Minimum Indicator
To decide whether or not there is a recession, PMES takes the minimum of either McKelvey or Job Openings.
That touches all the background bases. Now let’s look at the charts that comprise the lead chart.
Unemployment Rate vs Job Opening Rate
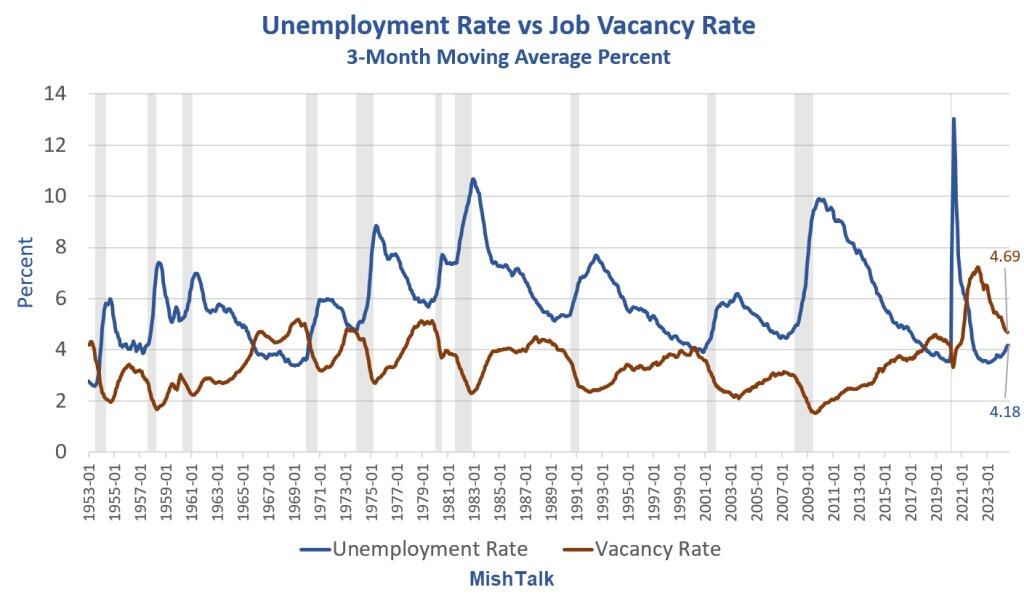
Openings dwindle in recessions while the unemployment rate tends to rise.
Combining the two ideas makes for a better indicator.
McKelvey Recession Indicator
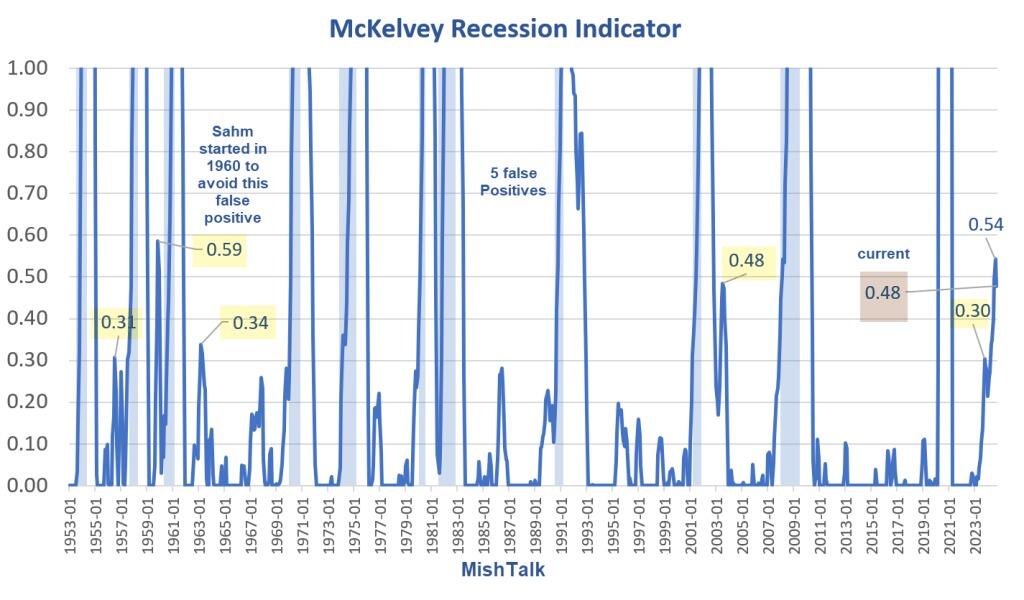
McKelvey has had five false positives.
Job Openings PMES Recession Indicator
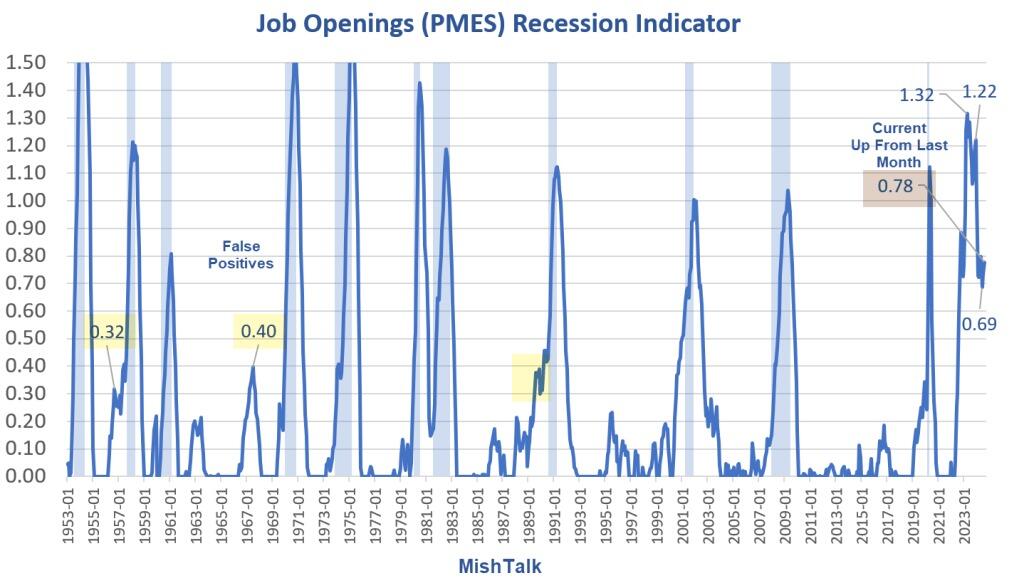
PMES has likewise had false positives. However, the PMES false positives do not overlap with McKelvey false positives.
Combining the two indicators (the minimum of PMES and McKelvey) creates the lead chart.
For example the PMES reading is 0.78 and the McKelvey reading is 0.48. The Minimum is 0.48 shown in the lead chart.
The McKelvey Recession Indicator Triggered, But What Are the Odds?
On September 10, I posted The McKelvey Recession Indicator Triggered, But What Are the Odds?
In the above link I go over a method of calculating recession odds based off McKelvey alone. As numbers rise, the odds of recession rise exponentially not linearly.
Between 0.4 and 0.5 the odds of recession are over 50 percent and that is based off a single indicator, not both.
September Jobs Report
Finally, the September jobs report is more than a bit screwy, impacting the above calculations.
For discussion, please see The BLS Reports Jobs Rebounded More Than Expected in September
The BLS reports payroll employment rises by 254,000 in September. I discussed two reasons the report is suspect.
Also see Government Employment Rose by an Amazing 785,000 in September
I am confident something (many things?) went totally nuts in BLS sampling or assumptions.
The economy did not suddenly add 785,000 government workers in September.
Loading…