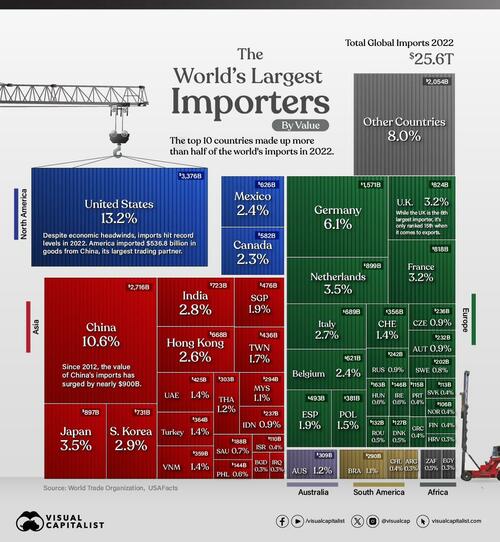
In 2022, global imports climbed to $25.6 trillion in value, or about the size of the U.S. GDP.
As an engine of growth, global trade broadens consumer choices and can lower the cost of goods. For businesses, it can improve the quality of inputs and strengthen competitiveness.
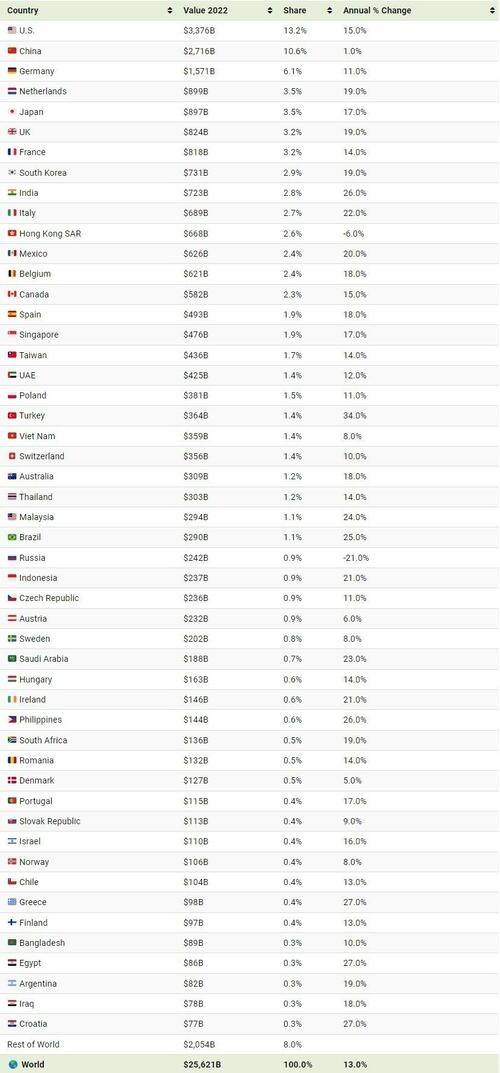
In the graphic below, Visual Capitalist's Dorothy Neufeld and Christina Kostandi show the 50 largest importers, with data from the World Trade Organization.
Which Countries Import the Most Goods?
With $3.4 trillion in imports in 2022, the U.S. is the largest importer globally.
Even though higher inflation and market uncertainty loomed over the economy, U.S. imports increased 15% annually, with China as its top goods importing partner.
As the world’s second-largest economy, China’s imports hit $2.7 trillion in value, although growth slowed in 2022.
Taiwan, China’s top trading partner for imports, is a major provider of electronics products, including semiconductor chips. However, the China-Taiwan trade relationship remains complicated given geopolitical tensions sparking unexpected import bans.
A handful of European countries also fell in the top 10 importers, led by Germany and the Netherlands. Overall, the European Union is the largest importer of agricultural products, fuels and mining products, and automotive products globally.
Global Trade Fragmentation
In 2023, the World Trade Organization projects that import volumes will contract as much as 1.2% across North and South America, Asia, and Europe.
In part, this is being driven by slower demand in manufacturing economies.
Whether or not this weaker volume is also being impacted by trade fragmentation remains unclear. One indicator may be seen in the trade of intermediate goods, which are products like wood and steel that are used in the production of a final good.
In the first half of 2023, the share of intermediate goods in world trade dropped to 48.5%, down from its three-year average of 51%. On the one hand, this may suggest that supply chains are contracting. Yet it may also be due to the influence of higher commodity prices, which have a bigger impact on the cost of intermediate goods than on final goods.
Still, other factors have an impact on the flow of trade. These include subsidies, export bans, and legislative policy, such as the $52.7 billion U.S. CHIPS Act, that incentivizes local production of semiconductors.
Considering these factors, broader trends of global de-globalization remain to be seen.
In 2022, global imports climbed to $25.6 trillion in value, or about the size of the U.S. GDP.
As an engine of growth, global trade broadens consumer choices and can lower the cost of goods. For businesses, it can improve the quality of inputs and strengthen competitiveness.
In the graphic below, Visual Capitalist’s Dorothy Neufeld and Christina Kostandi show the 50 largest importers, with data from the World Trade Organization.
Which Countries Import the Most Goods?
With $3.4 trillion in imports in 2022, the U.S. is the largest importer globally.
Even though higher inflation and market uncertainty loomed over the economy, U.S. imports increased 15% annually, with China as its top goods importing partner.
As the world’s second-largest economy, China’s imports hit $2.7 trillion in value, although growth slowed in 2022.
Taiwan, China’s top trading partner for imports, is a major provider of electronics products, including semiconductor chips. However, the China-Taiwan trade relationship remains complicated given geopolitical tensions sparking unexpected import bans.
A handful of European countries also fell in the top 10 importers, led by Germany and the Netherlands. Overall, the European Union is the largest importer of agricultural products, fuels and mining products, and automotive products globally.
Global Trade Fragmentation
In 2023, the World Trade Organization projects that import volumes will contract as much as 1.2% across North and South America, Asia, and Europe.
In part, this is being driven by slower demand in manufacturing economies.
Whether or not this weaker volume is also being impacted by trade fragmentation remains unclear. One indicator may be seen in the trade of intermediate goods, which are products like wood and steel that are used in the production of a final good.
In the first half of 2023, the share of intermediate goods in world trade dropped to 48.5%, down from its three-year average of 51%. On the one hand, this may suggest that supply chains are contracting. Yet it may also be due to the influence of higher commodity prices, which have a bigger impact on the cost of intermediate goods than on final goods.
Still, other factors have an impact on the flow of trade. These include subsidies, export bans, and legislative policy, such as the $52.7 billion U.S. CHIPS Act, that incentivizes local production of semiconductors.
Considering these factors, broader trends of global de-globalization remain to be seen.
Loading…


