Authored by Katie Spence via The Epoch Times (emphasis ours),
To preserve a “livable planet,” the Earth can’t warm more than 1.5 degrees Celsius above pre-industrial levels, the United Nations warns.

Failure to maintain that level could lead to several catastrophes, including increased droughts and weather-related disasters, more heat-related illnesses and deaths, and less food and more poverty, according to NASA.
To avert the looming tribulations and limit global temperature increases, 194 member states and the European Union in 2016 signed the U.N. Paris Agreement, a legally binding international treaty with a goal to “substantially reduce global greenhouse gas emissions.”
After the agreement, global spending on climate-related projects increased exponentially.
In 2021 and 2022, the world’s taxpayers spent, on average, $1.3 trillion on such projects each year, according to the nonprofit advisory group Climate Policy Initiative.
That’s more than double the spending rate in 2019 and 2020, which came in at $653 billion per year, and it’s significantly up from the $364 billion per year in 2011 and 2012, the report found.
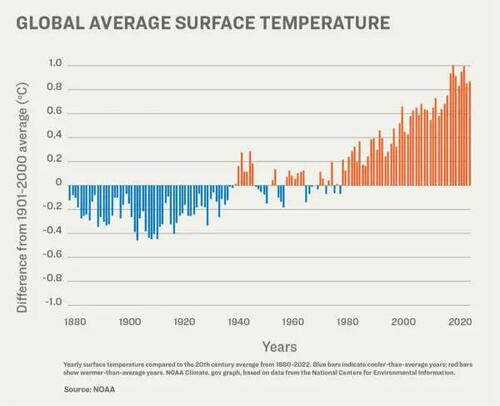
Despite the money pouring in, the National Oceanic and Atmospheric Administration (NOAA) reported that 2023 was the hottest year on record.
NOAA’s climate monitoring stations found that the Earth’s average land and ocean surface temperature in 2023 was 1.35 degrees Celsius above the pre-industrial average.
“Not only was 2023 the warmest year in NOAA’s 174-year climate record—it was the warmest by far,” said Sarah Kapnick, NOAA’s chief scientist.
“A warming planet means we need to be prepared for the impacts of climate change that are happening here and now, like extreme weather events that become both more frequent and severe.”
But a growing chorus of climate scientists are saying the temperature readings are faulty and that the trillions of dollars pouring in are based on a problem that doesn’t exist.
More than 90 percent of NOAA’s temperature monitoring stations have a heat bias, according to Anthony Watts, a meteorologist, senior fellow for environment and climate at The Heartland Institute, author of climate website Watts Up With That, and director of a study that examined NOAA’s climate stations.
“And with that large of a number, over 90 percent, the methods that NOAA employs to try to reduce this don’t work because the bias is so overwhelming,” Mr. Watts told The Epoch Times.
“The few stations that are left that are not biased because they are, for example, outside of town in a field and are an agricultural research station that’s been around for 100 years ... their data gets completely swamped by the much larger set of biased data. There’s no way you can adjust that out.”

Meteorologist Roy Spencer agreed.
“The surface thermometer data still have spurious warming effects due to the urban heat island, which increases over time,” Mr. Spencer said.
He is the principal research scientist at the University of Alabama, the U.S. Science Team leader for the Advanced Microwave Scanning Radiometer on NASA’s Aqua satellite, and the recipient of NASA’s Exceptional Scientific Achievement Medal for his work with satellite-based temperature monitoring.
Mr. Spencer also said computerized climate models used to drive changes in energy policy are even more faulty.
Lt. Col. John Shewchuk, a certified consulting meteorologist, said the problems with temperature readings go beyond heat bias. The retired lieutenant colonel was an advanced weather officer in the Air Force.
“After seeing many reports about NOAA’s adjustments to the USHCN [U.S. Historical Climatology Network] temperature data, I decided to download and analyze the data myself,” Lt. Col. Shewchuk told The Epoch Times.
“I was able to confirm what others have found. It is obvious that, overall, the past temperatures were cooled while the present temperatures were warmed.”
He contends that NOAA and NASA have adjusted historical temperature data in such a way as to make the past appear colder and, by so doing, make the current warming trend more pronounced.
Faulty Temperature Readings
The urban heat island effect causes higher temperatures in areas where there are more buildings, roads, and other forms of infrastructure that absorb and then radiate the sun’s heat, according to the Environmental Protection Agency.
The agency estimates that “daytime temperatures in urban areas are 1–7 degrees Fahrenheit higher than temperatures in outlying areas, and nighttime temperatures are about 2–5 degrees Fahrenheit higher.”
Consequently, NOAA requires all its climate observation stations to be located at least 100 feet away from elements such as concrete, asphalt, and buildings.

However, in March 2009, Mr. Watts released a report that shows that 89 percent of NOAA’s stations had heat bias issues due to being located within 100 feet of those elements, and many were located by airport runways.
“We found stations located next to the exhaust fans of air conditioning units, surrounded by asphalt parking lots and roads, on blistering-hot rooftops, and near sidewalks and buildings that absorb and radiate heat,” Mr. Watts said.
“We found 68 stations located at wastewater treatment plants, where the process of waste digestion causes temperatures to be higher than in surrounding areas.”
The report concluded that the U.S. temperature record was unreliable, and because it was considered “the best in the world,” global temperature databases were also “compromised and unreliable.”
Following the report, the U.S. Office of Inspector General (OIG) and the Government Accountability Office confirmed Mr. Watt’s findings and stated that NOAA was taking steps to address the issues.
“NOAA acknowledges that there are problems with the USHCN data due to biases introduced by such means as undocumented site relocation, poor siting, or instrument changes,” the OIG report reads.
“All of the experts thought that an improved, modernized climate reporting system is necessary to eliminate the need for data adjustments.”
Despite the assurances, Mr. Watts had doubts about NOAA addressing the issues and in April 2022 and May 2022, he and his team revisited many of the same temperature stations they had observed in 2009.
He published his findings in a new study on July 27, 2022. It found that even more, approximately 96 percent, of NOAA’s temperature stations still failed to meet its own standards.
“There are two main biases in the surface temperature network for the United States, and most likely the world, that I have identified,” Mr. Watts said.
“The biggest bias is the urban heat island effect. What happens is that because heat is retained by the surfaces and released into the air at night, the night’s low temperature is not as low as it could be if the thermometer were outside of town and in a field.”

Over the years, he said, more and more infrastructure has been built up around the thermometer locations, and at night, the asphalt and concrete release the absorbed heat and push up the temperature.
“You can look at any set of climate data, no matter who produces it, and you can see this effect. The low temperatures are trending upward much faster, and the high temperatures are virtually unchanged. But it’s the average temperature that’s being used to track climate change,” Mr. Watts said.
He said that even though both NOAA and NASA claim that they can adjust their data to account for the urban heat island effect, the bias is impossible to overcome because the problem impacts 96 percent of surface stations.
He said the few thermometers located at climate stations not experiencing a heat bias show half the rate of warming currently being reported.
Transient Temperature
The second primary bias that Mr. Watts identified is the transient temperature readings, which are short-term temperature changes that can give a false reading.
NOAA started switching out their mercury thermometers in the mid-to-late 1980s, according to Mr. Watts.
Read the rest here...
Authored by Katie Spence via The Epoch Times (emphasis ours),
To preserve a “livable planet,” the Earth can’t warm more than 1.5 degrees Celsius above pre-industrial levels, the United Nations warns.

Failure to maintain that level could lead to several catastrophes, including increased droughts and weather-related disasters, more heat-related illnesses and deaths, and less food and more poverty, according to NASA.
To avert the looming tribulations and limit global temperature increases, 194 member states and the European Union in 2016 signed the U.N. Paris Agreement, a legally binding international treaty with a goal to “substantially reduce global greenhouse gas emissions.”
After the agreement, global spending on climate-related projects increased exponentially.
In 2021 and 2022, the world’s taxpayers spent, on average, $1.3 trillion on such projects each year, according to the nonprofit advisory group Climate Policy Initiative.
That’s more than double the spending rate in 2019 and 2020, which came in at $653 billion per year, and it’s significantly up from the $364 billion per year in 2011 and 2012, the report found.
Despite the money pouring in, the National Oceanic and Atmospheric Administration (NOAA) reported that 2023 was the hottest year on record.
NOAA’s climate monitoring stations found that the Earth’s average land and ocean surface temperature in 2023 was 1.35 degrees Celsius above the pre-industrial average.
“Not only was 2023 the warmest year in NOAA’s 174-year climate record—it was the warmest by far,” said Sarah Kapnick, NOAA’s chief scientist.
“A warming planet means we need to be prepared for the impacts of climate change that are happening here and now, like extreme weather events that become both more frequent and severe.”
But a growing chorus of climate scientists are saying the temperature readings are faulty and that the trillions of dollars pouring in are based on a problem that doesn’t exist.
More than 90 percent of NOAA’s temperature monitoring stations have a heat bias, according to Anthony Watts, a meteorologist, senior fellow for environment and climate at The Heartland Institute, author of climate website Watts Up With That, and director of a study that examined NOAA’s climate stations.
“And with that large of a number, over 90 percent, the methods that NOAA employs to try to reduce this don’t work because the bias is so overwhelming,” Mr. Watts told The Epoch Times.
“The few stations that are left that are not biased because they are, for example, outside of town in a field and are an agricultural research station that’s been around for 100 years … their data gets completely swamped by the much larger set of biased data. There’s no way you can adjust that out.”

Meteorologist Roy Spencer agreed.
“The surface thermometer data still have spurious warming effects due to the urban heat island, which increases over time,” Mr. Spencer said.
He is the principal research scientist at the University of Alabama, the U.S. Science Team leader for the Advanced Microwave Scanning Radiometer on NASA’s Aqua satellite, and the recipient of NASA’s Exceptional Scientific Achievement Medal for his work with satellite-based temperature monitoring.
Mr. Spencer also said computerized climate models used to drive changes in energy policy are even more faulty.
Lt. Col. John Shewchuk, a certified consulting meteorologist, said the problems with temperature readings go beyond heat bias. The retired lieutenant colonel was an advanced weather officer in the Air Force.
“After seeing many reports about NOAA’s adjustments to the USHCN [U.S. Historical Climatology Network] temperature data, I decided to download and analyze the data myself,” Lt. Col. Shewchuk told The Epoch Times.
“I was able to confirm what others have found. It is obvious that, overall, the past temperatures were cooled while the present temperatures were warmed.”
He contends that NOAA and NASA have adjusted historical temperature data in such a way as to make the past appear colder and, by so doing, make the current warming trend more pronounced.
Faulty Temperature Readings
The urban heat island effect causes higher temperatures in areas where there are more buildings, roads, and other forms of infrastructure that absorb and then radiate the sun’s heat, according to the Environmental Protection Agency.
The agency estimates that “daytime temperatures in urban areas are 1–7 degrees Fahrenheit higher than temperatures in outlying areas, and nighttime temperatures are about 2–5 degrees Fahrenheit higher.”
Consequently, NOAA requires all its climate observation stations to be located at least 100 feet away from elements such as concrete, asphalt, and buildings.

However, in March 2009, Mr. Watts released a report that shows that 89 percent of NOAA’s stations had heat bias issues due to being located within 100 feet of those elements, and many were located by airport runways.
“We found stations located next to the exhaust fans of air conditioning units, surrounded by asphalt parking lots and roads, on blistering-hot rooftops, and near sidewalks and buildings that absorb and radiate heat,” Mr. Watts said.
“We found 68 stations located at wastewater treatment plants, where the process of waste digestion causes temperatures to be higher than in surrounding areas.”
The report concluded that the U.S. temperature record was unreliable, and because it was considered “the best in the world,” global temperature databases were also “compromised and unreliable.”
Following the report, the U.S. Office of Inspector General (OIG) and the Government Accountability Office confirmed Mr. Watt’s findings and stated that NOAA was taking steps to address the issues.
“NOAA acknowledges that there are problems with the USHCN data due to biases introduced by such means as undocumented site relocation, poor siting, or instrument changes,” the OIG report reads.
“All of the experts thought that an improved, modernized climate reporting system is necessary to eliminate the need for data adjustments.”
Despite the assurances, Mr. Watts had doubts about NOAA addressing the issues and in April 2022 and May 2022, he and his team revisited many of the same temperature stations they had observed in 2009.
He published his findings in a new study on July 27, 2022. It found that even more, approximately 96 percent, of NOAA’s temperature stations still failed to meet its own standards.
“There are two main biases in the surface temperature network for the United States, and most likely the world, that I have identified,” Mr. Watts said.
“The biggest bias is the urban heat island effect. What happens is that because heat is retained by the surfaces and released into the air at night, the night’s low temperature is not as low as it could be if the thermometer were outside of town and in a field.”

Over the years, he said, more and more infrastructure has been built up around the thermometer locations, and at night, the asphalt and concrete release the absorbed heat and push up the temperature.
“You can look at any set of climate data, no matter who produces it, and you can see this effect. The low temperatures are trending upward much faster, and the high temperatures are virtually unchanged. But it’s the average temperature that’s being used to track climate change,” Mr. Watts said.
He said that even though both NOAA and NASA claim that they can adjust their data to account for the urban heat island effect, the bias is impossible to overcome because the problem impacts 96 percent of surface stations.
He said the few thermometers located at climate stations not experiencing a heat bias show half the rate of warming currently being reported.
Transient Temperature
The second primary bias that Mr. Watts identified is the transient temperature readings, which are short-term temperature changes that can give a false reading.
NOAA started switching out their mercury thermometers in the mid-to-late 1980s, according to Mr. Watts.
Read the rest here…
Loading…


