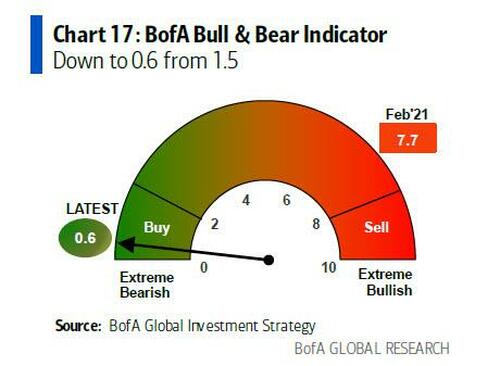
One week ago, after 7 consecutive weeks of declines for the S&P (and a record 8 weeks for the Dow), One River CIO Eric Peters said that "If We Can't Bounce After Being Down 7 Weeks In A Row, Something Is Seriously Wrong." It was also around that time that BofA's in house doom and gloomer, Michael Hartnett, issued his latest warning that his new "bull case" for the market is 3,600 and while he would “sell-any-rips”, he warned that "the tape remains very vulnerable to a bear market rally," a vulnerability which only increased as the bank's Bull and Bear market indicator swung further into panic territory dropping from 1.5 to 0.6, the lowest level since March 2020.
Well, fast forward to today when we have finally bounce, and yes, the bear market rally finally appeared...
BofA Bull and Bear Indicator hits 0.6, one of the lowest prints on record.
— zerohedge (@zerohedge) May 27, 2022
Unless the Fed quietly launches a nuke at the US, a big bear market rally is coming pic.twitter.com/aXoJOgrbqh
... and after briefly dipping into a bear market one week ago, the S&P exploded 6.6% higher this week, its best weekly advance since Nov 2020.
While this is hardly the end of the bear market, which we expect to resume in earnest shortly. it was enough to give Hartnett a break from his usual weekly fire and brimstone sermon, and instead his latest Flow Show was titled simply enough "It's Back On" (full note is available to professional subs).
Picking up where he left off last week, Hartnett writes that the summer rally bandwagon is growing: the number of bears is soaring (see the abovementioned plunge in the BofA Bull & Bear Indicator) add growing speculation of both “peak” inflation and Fed "pause", and mix in the most oversold stocks relative to 200dma, and you get tradable bounce dynamite.
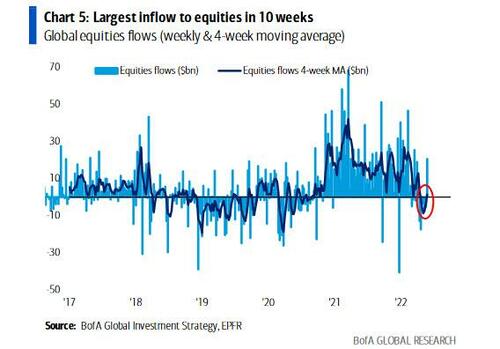
Not that this was exactly surprising to investors who clearly were aware of what is coming and as Hartnett notes, citing the latest EPFT data, this week saw $20.6BN in cash piled into to equities, the most in 10 weeks, as well as $0.8bn into gold, 28.2BN to cash, funded by another $5.8BN pulled from bonds.
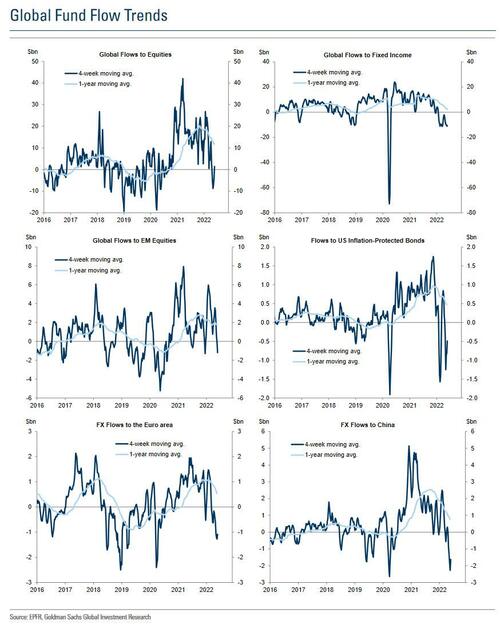
Some more details from Goldman: net flows into global equity funds turned positive in the week ending May 25n (+$21bn vs -$5bn the prior week), following net outflows over the prior six weeks. The turn reflected greater net purchases for the US market, primarily due to a spike in ETF inflows (although mutual fund flows were also less negative).
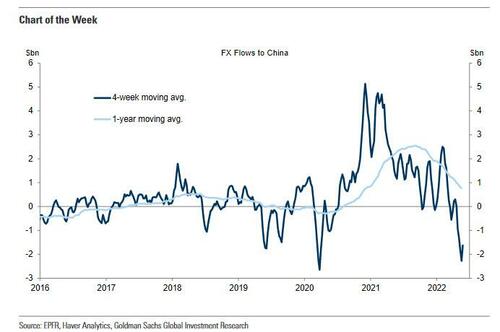
Not that this week was some kind of "all clear" - as Goldman notes, net outflows continued for most other markets, mostly at a steady or slightly reduced pace; although mainland China equities saw net inflows on the week.
By sector, the largest net inflows (scaled by AUM) were into telecom, consumer goods, and infrastructure; the largest net outflows were from industrials.
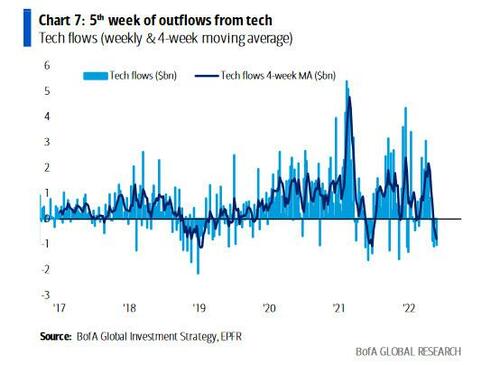
Some more detailed flow details from BofA, which also highlights the 5th week of outflow from tech ($1.0bn),
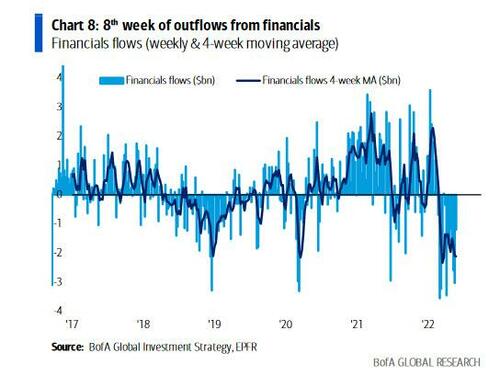
8th week outflow from financials ($1.2bn);
Outflows from IG + HY + EM debt continue ($8.3bn);
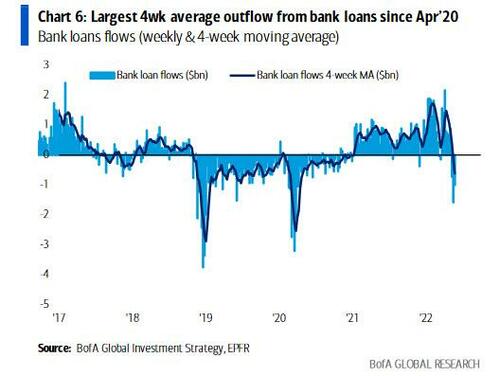
Largest 4-week outflow from bank loans since Apr’20 ($0.6bn);
Finally, last week also saw the largest inflow consumer stocks since Dec’21 ($1.2bn).
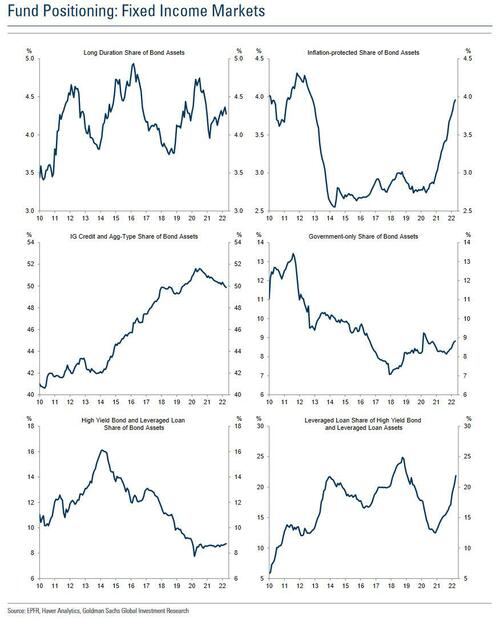
In credit, flows into global fixed income funds were negative for the 19th week out of the last 20 (-$7bn vs -$14bn the prior week). Outflows from HY credit products and EM fixed income slowed but remained negative; inflows into government-only funds continued. Money market fund assets increased by $28bn.
So after this week's ramp has Hartnett's infamous pessimism eased? Not one bit.
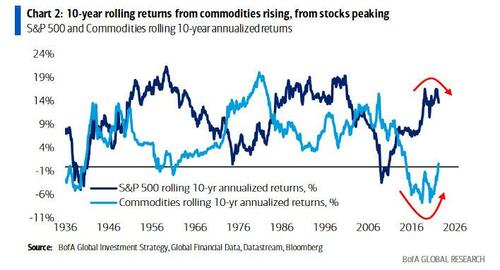
First, the strategist shows a chart of rolling equity vs commodity returns and notes that "secular 10-year returns from commodities are on the rise (latest 0.7% +ve for 1st time since Nov'14), while those from stocks are peaking (13.7%, down from 16.6% in Sep'21), and those from bonds are already falling (2.7%, lowest since Oct'81).
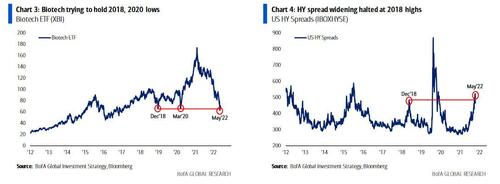
Next, as he explains when looking at the "tale of the tape", we saw sneaky new highs in oil (which tarnishes the "peak inflation" argument), crypto continues to see a very limited bid (low speculative animal spirits), but MOVE (Treasury volatility) is off its highs (it served as the epicenter of the risk-off), with biotech trying to hold 2018, 2020 lows (XBI $65) to confirm "peak yields", and best of all, the IG & HY spread widening halted at 2018 highs, which even Hartnett has to admit is positive for risk...
... but not positive enough for the BofA strategist to say BTFD and instead he concludes that "we fade rallies (e.g. SPX >4200)... but not in rush."
One week ago, after 7 consecutive weeks of declines for the S&P (and a record 8 weeks for the Dow), One River CIO Eric Peters said that “If We Can’t Bounce After Being Down 7 Weeks In A Row, Something Is Seriously Wrong.“ It was also around that time that BofA’s in house doom and gloomer, Michael Hartnett, issued his latest warning that his new “bull case” for the market is 3,600 and while he would “sell-any-rips”, he warned that “the tape remains very vulnerable to a bear market rally,” a vulnerability which only increased as the bank’s Bull and Bear market indicator swung further into panic territory dropping from 1.5 to 0.6, the lowest level since March 2020.
Well, fast forward to today when we have finally bounce, and yes, the bear market rally finally appeared…
BofA Bull and Bear Indicator hits 0.6, one of the lowest prints on record.
Unless the Fed quietly launches a nuke at the US, a big bear market rally is coming pic.twitter.com/aXoJOgrbqh
— zerohedge (@zerohedge) May 27, 2022
… and after briefly dipping into a bear market one week ago, the S&P exploded 6.6% higher this week, its best weekly advance since Nov 2020.
While this is hardly the end of the bear market, which we expect to resume in earnest shortly. it was enough to give Hartnett a break from his usual weekly fire and brimstone sermon, and instead his latest Flow Show was titled simply enough “It’s Back On” (full note is available to professional subs).
Picking up where he left off last week, Hartnett writes that the summer rally bandwagon is growing: the number of bears is soaring (see the abovementioned plunge in the BofA Bull & Bear Indicator) add growing speculation of both “peak” inflation and Fed “pause”, and mix in the most oversold stocks relative to 200dma, and you get tradable bounce dynamite.
Not that this was exactly surprising to investors who clearly were aware of what is coming and as Hartnett notes, citing the latest EPFT data, this week saw $20.6BN in cash piled into to equities, the most in 10 weeks, as well as $0.8bn into gold, 28.2BN to cash, funded by another $5.8BN pulled from bonds.
Some more details from Goldman: net flows into global equity funds turned positive in the week ending May 25n (+$21bn vs -$5bn the prior week), following net outflows over the prior six weeks. The turn reflected greater net purchases for the US market, primarily due to a spike in ETF inflows (although mutual fund flows were also less negative).
Not that this week was some kind of “all clear” – as Goldman notes, net outflows continued for most other markets, mostly at a steady or slightly reduced pace; although mainland China equities saw net inflows on the week.
By sector, the largest net inflows (scaled by AUM) were into telecom, consumer goods, and infrastructure; the largest net outflows were from industrials.
Some more detailed flow details from BofA, which also highlights the 5th week of outflow from tech ($1.0bn),
8th week outflow from financials ($1.2bn);
Outflows from IG + HY + EM debt continue ($8.3bn);
Largest 4-week outflow from bank loans since Apr’20 ($0.6bn);
Finally, last week also saw the largest inflow consumer stocks since Dec’21 ($1.2bn).
In credit, flows into global fixed income funds were negative for the 19th week out of the last 20 (-$7bn vs -$14bn the prior week). Outflows from HY credit products and EM fixed income slowed but remained negative; inflows into government-only funds continued. Money market fund assets increased by $28bn.
So after this week’s ramp has Hartnett’s infamous pessimism eased? Not one bit.
First, the strategist shows a chart of rolling equity vs commodity returns and notes that “secular 10-year returns from commodities are on the rise (latest 0.7% +ve for 1st time since Nov’14), while those from stocks are peaking (13.7%, down from 16.6% in Sep’21), and those from bonds are already falling (2.7%, lowest since Oct’81).
Next, as he explains when looking at the “tale of the tape”, we saw sneaky new highs in oil (which tarnishes the “peak inflation” argument), crypto continues to see a very limited bid (low speculative animal spirits), but MOVE (Treasury volatility) is off its highs (it served as the epicenter of the risk-off), with biotech trying to hold 2018, 2020 lows (XBI $65) to confirm “peak yields”, and best of all, the IG & HY spread widening halted at 2018 highs, which even Hartnett has to admit is positive for risk…
… but not positive enough for the BofA strategist to say BTFD and instead he concludes that “we fade rallies (e.g. SPX >4200)… but not in rush.”
