Authored by Charles Hugh Smith via OfTwoMinds blog,
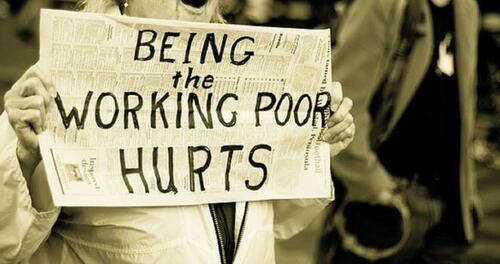
Measured by the purchasing power of our wages/work, we're definitively poorer, as it takes far more hours of work now to pay rent.
Let's not over-complicate what's straightforward: we're becoming more prosperous when our wages / labor buy more goods and services, most especially the essentials of life: shelter, food, energy, utilities, transportation, higher education, healthcare and childcare. If the money we have left after paying for essentials buys more discretionary goods and services, we're getting a lagniappe of prosperity.
If the non-discretionary essentials are consuming a greater percentage of our earned income, we're becoming less prosperous, i.e. we're poorer. Those tasked with persuading us that gradual impoverishment is actually soaring prosperity have near-infinite statistical means to obscure this straightforward measure of prosperity: the purchasing power of labor / earnings.
If our hours of work buy less non-discretionary goods and services, we're getting poorer.
That software, TVs and airline fares are cheaper is meaningless because they are occasional discretionary purchases that make up a tiny slice of total cost-of-living expenditures. The status quo cheerleaders in the Ministry of Truth ignore the $5,000 annual cost increases in essentials while trumpeting the $100 decline in occasional discretionary purchases.
Your vacation cost you 100 more hours of work, but you save $50 on airfare, so it all evens out. Um, no. The only metric that is an accurate measure of prosperity and impoverishment is the purchasing power of your labor / earnings. Everything else is noise designed to obscure inconvenient reality.
Not surprisingly, it's difficult to get accurate data on past real-world costs of essentials. What we hope to find is the actual prices paid in previous years and the median wages paid at the same time.
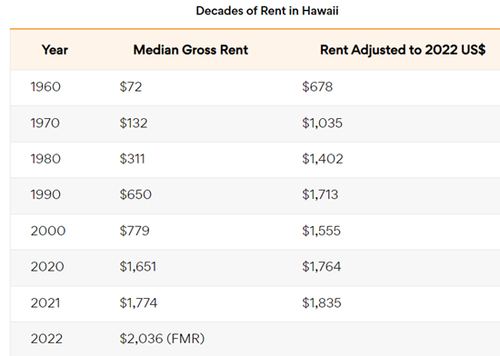
This data gives us an accurate measure of purchasing power: how many hours of work did it take to pay rent, pay healthcare insurance, buy a used car, etc. This is the kind of table we hope to find: rents paid in Hawaii by decade.
Since I lived in Honolulu, the home of the majority of the state's population, and actively sought rental housing in the 1970s, I have knowledge of actual rents, and can attest these numbers are in the ballpark for one-bedroom apartments.
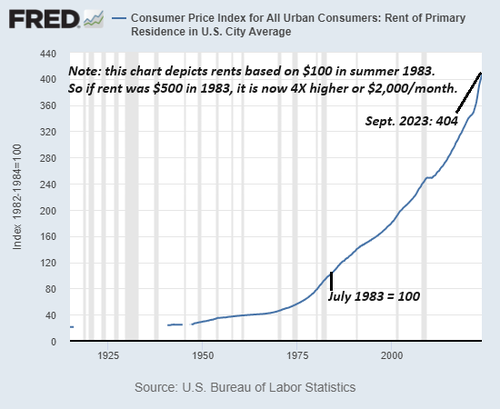
But what we often get is data that's been adjusted and is difficult to align with real-world costs. Here is the Federal Reserve database (FRED) chart of consumer price index for urban rents of primary residences, which includes everything from a shabby studio to a sprawling single-family dwelling. That range makes it less useful than specific numbers for specific classes of rentals.
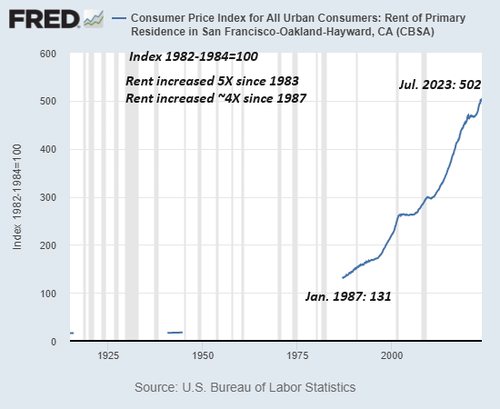
The data isn't actual rents paid; it's an index that's arbitrarily set to 100 in summer of 1983. So if your rent was $500 a month in 1983, the equivalent rent today is 4X or $2,000. Additionally, data can be scarce, as in this chart of rents in the high-cost San Francisco Bay Area, where I also sought rental housing, so I know actual rent costs from the 1980s on.
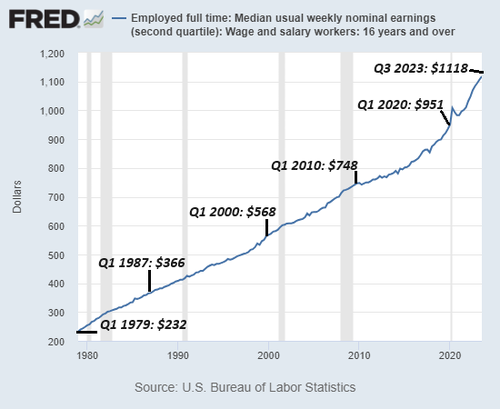
Fortunately, there's a simple chart of median weekly earnings for full-time workers from the first quarter of 1979 to the third quarter of 2023. Now we can make very simple calculations of purchasing power: how many hours of median-wage work does it take to pay typical market-rate rent? To keep it simple, let's use total earnings before taxes and deductions.
In 1978, I was earning $300/week as a young construction worker, somewhat above the median wage of $232/week. I rented a small, shabby studio for $135/month, well below the average rent of $250/month for a one-bedroom apartment. The market included a wide range of rental options, a big difference from most markets now, in which there are few low-rent options even in not-so-great parts of town.
It took 18 hours of work to pay my rent for the month-- 2.25 days. If I'd paid the average rent of $250/month, it wuld have taken 33 hours of work, or about 4 days to pay rent. If I'd earned the median wage and paid the average rent, it would have taken 43 hours or about a week's earning to pay the rent.
In 1987 in the high-cost S.F. Bay Area, my wage had dropped to around the median and I was paying $550/month for a one-bedroom apartment, about $100/month below market. It took 55 hours of work to pay the rent, or about 7 days of work.
Let's stop for a moment and ask where in the urban U.S. can a 22-year old worker making a bit more than median wage pay the monthly rent with 2.25 days of work? In today's economy, my wages in 1978 would translate into about $1,400 per week ($35/hour), and so my studio apartment's rent would be 2.25 X my daily wage of $280 or $630/month.
I submit there are few urban areas in the U.S. where young workers with average skills and experience can earn $35/hour and rent a studio apartment for $630/month. What we find instead are rents in places like the S.F. Bay Area that average $2,400/month for one-bedroom apartments, so those earning the median weekly wage of $1,120 must devote 2.15 weeks of their earnings to pay rent--11 days of work, more than half their earnings.
This is almost triple the days of work needed to pay rent with a median wage in the 1970s, and 60% more than the days of work needed to pay rent in the 1980s and 1990s in two of the most expensive urban areas of the nation.
Measured by the purchasing power of our wages/work, we're definitively poorer, as it takes far more hours of work now to pay rent. If you need more evidence, consider the cost of decent (no deductable) healthcare insurance. In 1986, I paid $50/month each for my young, single employees, about 5.5 hours of the median wage.
Now the equivalent insurance costs a minimum of $350/month, or 12.5 hours of median-wage work--more than double the hours needed in the 1980s. I could go on, but isn't rent and healthcare insurance enough to prove that the vast majority of wage earners are far poorer now than they were two generations ago?
Over time, the decline in the purchasing power of our wages has stripped away hundreds of thousands of dollars of value over a lifetime of work. Rents that now require twice as many hours as they did 40 years ago mean we've lost $1,000 a month of purchasing power. Sorry, pundits, saving $20 on a low-quality toy or $100 on a low-quality TV or $100 on airfare doesn't offset $100,000 lost each decade in the purchasing power of work/wages.
Let's not overlook the fact that the median wage is skewed by high-wage workers. Tens of millions of workers earn far less than $1,120/week for full-time work.
Yes, the top 5% (which includes all the economists and pundits claiming we're all doing great) that collects almost 25% of all income are doing just fine, as their incomes have more than kept up with the staggering declines in purchasing power. The next 5% collect 15% of all income, so they're doing fine, too.
The rest of us--not so much. The bottom 80% of us earn less than half of all income. Factor in the dramatic loss of purchasing power, and we're much poorer.
* * *
My new book is now available at a 10% discount ($8.95 ebook, $18 print): Self-Reliance in the 21st Century. Read the first chapter for free (PDF)
Authored by Charles Hugh Smith via OfTwoMinds blog,
Measured by the purchasing power of our wages/work, we’re definitively poorer, as it takes far more hours of work now to pay rent.
Let’s not over-complicate what’s straightforward: we’re becoming more prosperous when our wages / labor buy more goods and services, most especially the essentials of life: shelter, food, energy, utilities, transportation, higher education, healthcare and childcare. If the money we have left after paying for essentials buys more discretionary goods and services, we’re getting a lagniappe of prosperity.
If the non-discretionary essentials are consuming a greater percentage of our earned income, we’re becoming less prosperous, i.e. we’re poorer. Those tasked with persuading us that gradual impoverishment is actually soaring prosperity have near-infinite statistical means to obscure this straightforward measure of prosperity: the purchasing power of labor / earnings.
If our hours of work buy less non-discretionary goods and services, we’re getting poorer.
That software, TVs and airline fares are cheaper is meaningless because they are occasional discretionary purchases that make up a tiny slice of total cost-of-living expenditures. The status quo cheerleaders in the Ministry of Truth ignore the $5,000 annual cost increases in essentials while trumpeting the $100 decline in occasional discretionary purchases.
Your vacation cost you 100 more hours of work, but you save $50 on airfare, so it all evens out. Um, no. The only metric that is an accurate measure of prosperity and impoverishment is the purchasing power of your labor / earnings. Everything else is noise designed to obscure inconvenient reality.
Not surprisingly, it’s difficult to get accurate data on past real-world costs of essentials. What we hope to find is the actual prices paid in previous years and the median wages paid at the same time.
This data gives us an accurate measure of purchasing power: how many hours of work did it take to pay rent, pay healthcare insurance, buy a used car, etc. This is the kind of table we hope to find: rents paid in Hawaii by decade.
Since I lived in Honolulu, the home of the majority of the state’s population, and actively sought rental housing in the 1970s, I have knowledge of actual rents, and can attest these numbers are in the ballpark for one-bedroom apartments.
But what we often get is data that’s been adjusted and is difficult to align with real-world costs. Here is the Federal Reserve database (FRED) chart of consumer price index for urban rents of primary residences, which includes everything from a shabby studio to a sprawling single-family dwelling. That range makes it less useful than specific numbers for specific classes of rentals.
The data isn’t actual rents paid; it’s an index that’s arbitrarily set to 100 in summer of 1983. So if your rent was $500 a month in 1983, the equivalent rent today is 4X or $2,000. Additionally, data can be scarce, as in this chart of rents in the high-cost San Francisco Bay Area, where I also sought rental housing, so I know actual rent costs from the 1980s on.
Fortunately, there’s a simple chart of median weekly earnings for full-time workers from the first quarter of 1979 to the third quarter of 2023. Now we can make very simple calculations of purchasing power: how many hours of median-wage work does it take to pay typical market-rate rent? To keep it simple, let’s use total earnings before taxes and deductions.
In 1978, I was earning $300/week as a young construction worker, somewhat above the median wage of $232/week. I rented a small, shabby studio for $135/month, well below the average rent of $250/month for a one-bedroom apartment. The market included a wide range of rental options, a big difference from most markets now, in which there are few low-rent options even in not-so-great parts of town.
It took 18 hours of work to pay my rent for the month– 2.25 days. If I’d paid the average rent of $250/month, it wuld have taken 33 hours of work, or about 4 days to pay rent. If I’d earned the median wage and paid the average rent, it would have taken 43 hours or about a week’s earning to pay the rent.
In 1987 in the high-cost S.F. Bay Area, my wage had dropped to around the median and I was paying $550/month for a one-bedroom apartment, about $100/month below market. It took 55 hours of work to pay the rent, or about 7 days of work.
Let’s stop for a moment and ask where in the urban U.S. can a 22-year old worker making a bit more than median wage pay the monthly rent with 2.25 days of work? In today’s economy, my wages in 1978 would translate into about $1,400 per week ($35/hour), and so my studio apartment’s rent would be 2.25 X my daily wage of $280 or $630/month.
I submit there are few urban areas in the U.S. where young workers with average skills and experience can earn $35/hour and rent a studio apartment for $630/month. What we find instead are rents in places like the S.F. Bay Area that average $2,400/month for one-bedroom apartments, so those earning the median weekly wage of $1,120 must devote 2.15 weeks of their earnings to pay rent–11 days of work, more than half their earnings.
This is almost triple the days of work needed to pay rent with a median wage in the 1970s, and 60% more than the days of work needed to pay rent in the 1980s and 1990s in two of the most expensive urban areas of the nation.
Measured by the purchasing power of our wages/work, we’re definitively poorer, as it takes far more hours of work now to pay rent. If you need more evidence, consider the cost of decent (no deductable) healthcare insurance. In 1986, I paid $50/month each for my young, single employees, about 5.5 hours of the median wage.
Now the equivalent insurance costs a minimum of $350/month, or 12.5 hours of median-wage work–more than double the hours needed in the 1980s. I could go on, but isn’t rent and healthcare insurance enough to prove that the vast majority of wage earners are far poorer now than they were two generations ago?
Over time, the decline in the purchasing power of our wages has stripped away hundreds of thousands of dollars of value over a lifetime of work. Rents that now require twice as many hours as they did 40 years ago mean we’ve lost $1,000 a month of purchasing power. Sorry, pundits, saving $20 on a low-quality toy or $100 on a low-quality TV or $100 on airfare doesn’t offset $100,000 lost each decade in the purchasing power of work/wages.
Let’s not overlook the fact that the median wage is skewed by high-wage workers. Tens of millions of workers earn far less than $1,120/week for full-time work.
Yes, the top 5% (which includes all the economists and pundits claiming we’re all doing great) that collects almost 25% of all income are doing just fine, as their incomes have more than kept up with the staggering declines in purchasing power. The next 5% collect 15% of all income, so they’re doing fine, too.
The rest of us–not so much. The bottom 80% of us earn less than half of all income. Factor in the dramatic loss of purchasing power, and we’re much poorer.
* * *
My new book is now available at a 10% discount ($8.95 ebook, $18 print): Self-Reliance in the 21st Century. Read the first chapter for free (PDF)
Loading…
