Despite the market's long-overdue rebound after a near-record 7 consecutive down weeks for the S&P (a 20yr record), the Fed has so far offered no help to risk assets and appears far from stepping in or triggering the elusive "Fed Put". This is despite, as BofA's Gonzalo Aziz warns in the bank's latest Global Equity Volatility Insights note (available to pro subs), risks building in financial markets to an extent that central banks wouldn’t have allowed in years past.
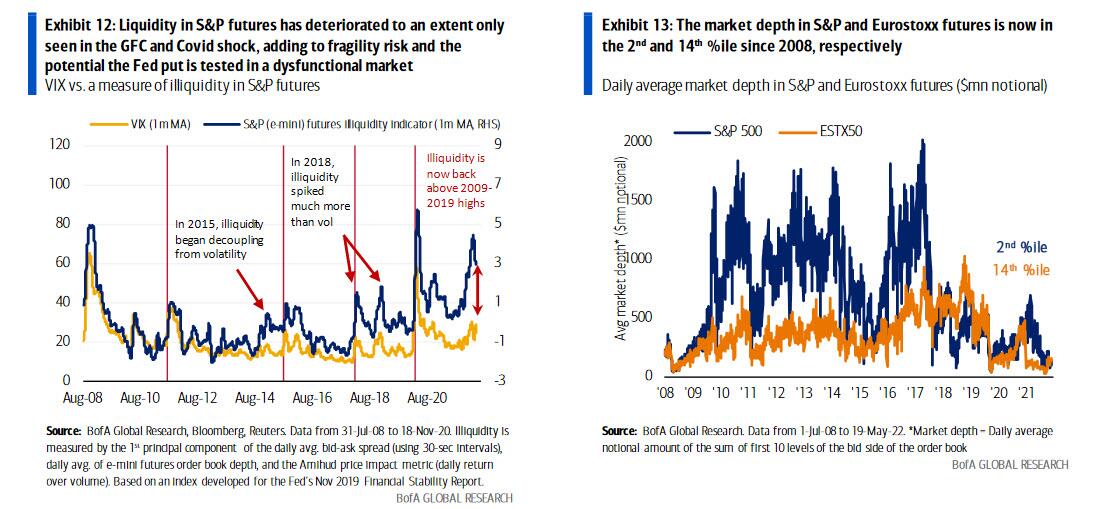
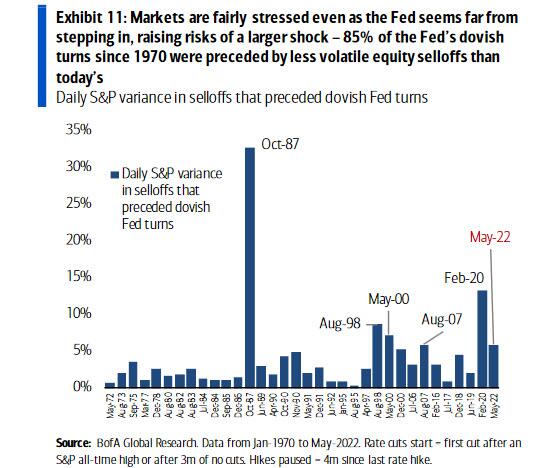
Indeed, as we observed recently (see "When Will The Fed Capitulate And Stop Hiking: Finally Some Good News For The Bulls"), credit spreads, historically the most reliable predictor of Fed interventions, have reached levels of prior Fed rescues. Furthermore, over 85% of dovish Fed turns in the last 50yrs were preceded by less volatile equity selloffs than today’s. And as we highlight virtually every day, S&P futures liquidity has only been worse in the depths of the GFC and the Covid shock, adding to fragility risk and the potential the Fed put is tested in a dysfunctional market.
And yet, despite all these growing risk-factors, so far Powell has ignored all appeals for help from the market. Of course, no matter how hard the US central bank may try to signal otherwise, the Fed put isn’t fully gone, and it will likely be tested, as it has repeatedly since Greenspan gave birth to it in 1987.
So what signposts should investors watch to know when the Fed put’s strike is near? According to Bank of America there are key indicators to keep an eye on:
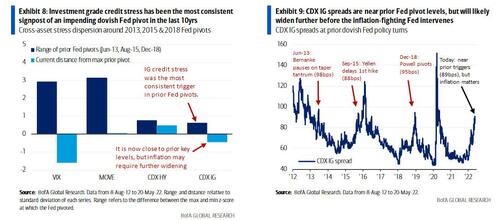
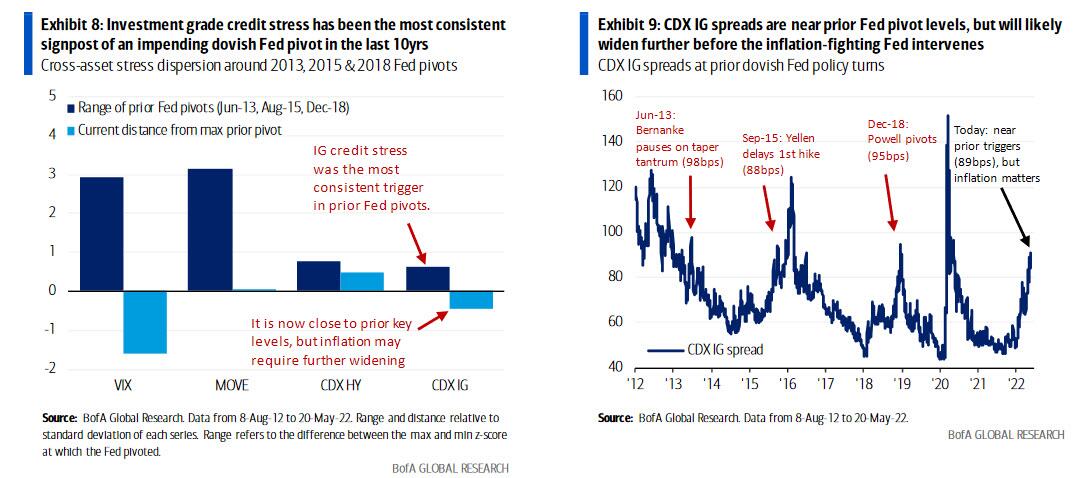
1. Credit stress: We have discussed before that credit stress has been the most consistent predictor of dovish Fed pivots in the last 10yrs, particularly stress in Investment Grade bonds (which have historically used by companies to fund buybacks, if not so much capex). This is notable because CDX IG spreads are near those key levels now, but the Fed’s focus on inflation means spreads are likely to widen further before triggering a policy response.

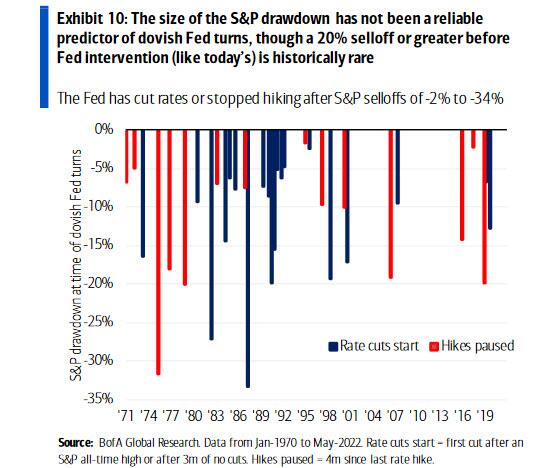
2. S&P drawdown: Perhaps just as important as nascent credit stress, the size of the equity drawdown from all-time highs has according to BofA become an important signal for investors looking to buy the dip in recent years. However, while this may have worked relatively well in the era of high Fed sensitivity to markets, it has been a much less reliable predictor of dovish Fed turns over a longer history. As chart 10 shows, the Fed has either stopped hiking or begun cutting rates during S&P drawdowns of very different magnitudes – from as low as 2-3% in the mid-1990s to over 30% in ‘75 and ‘87.

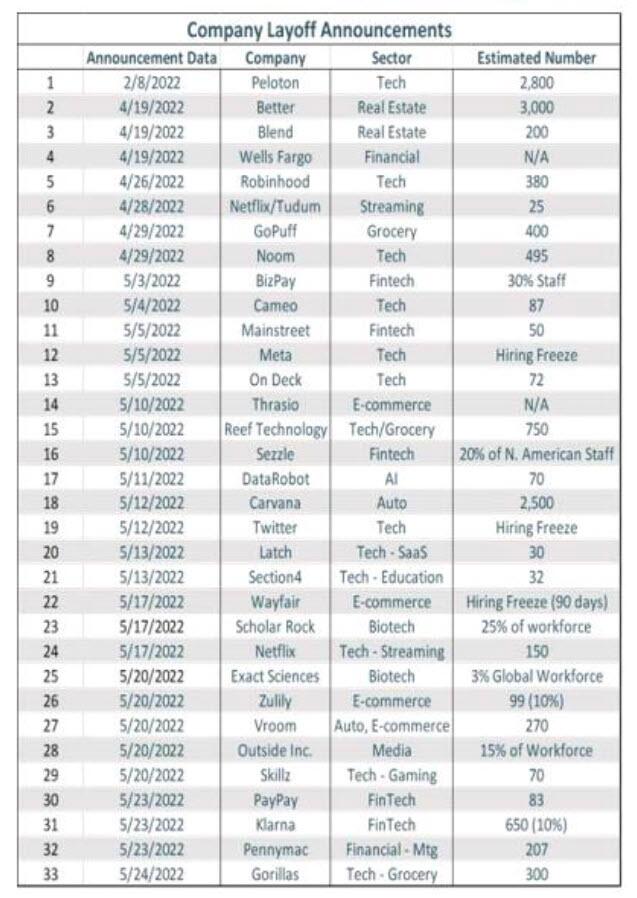
3. Economic data: Economic data is of course critical to the Fed’s reaction function, and a sustained cooling of inflationary pressures is arguably the data point most likely to slow their tightening plans (something we expect is gradually taking place now and will become manifest at the Jackson Hole PivotTM). Indeed, BofA's rates team’s 20-May Global Rates Weekly argues that a Fed pivot requires a meaningful slowdown in job market data. However, that type of data is much slower-moving, and it would take several months or quarters to convince the Fed that a dangerous inflationary spiral has been averted. On the other hand, as PIper Sandler quantified recent layoff announcements, it is clear that mass layoffs have begun, and the bank expects "a million layoffs or more" which will be more than sufficient to force the Fed to pivot.
4. Market dysfunction: While all of the above are certainly important catalysts for the Fed to "panic" and go into full-blown Fed Put mode, BofA's derivatives traders believe that an episode of market dysfunction is the most likely trigger for central banks, or as they quote us (quoting BofA's Michael Hartnett), “markets stop panicking when central banks start panicking”, but today it will take more market panic for the Fed to start panicking.
So are we there yet? Not quite, but getting closer. The near-record low liquidity in equity futures (a key feature of fragility shocks) which we highlight virtually every day...
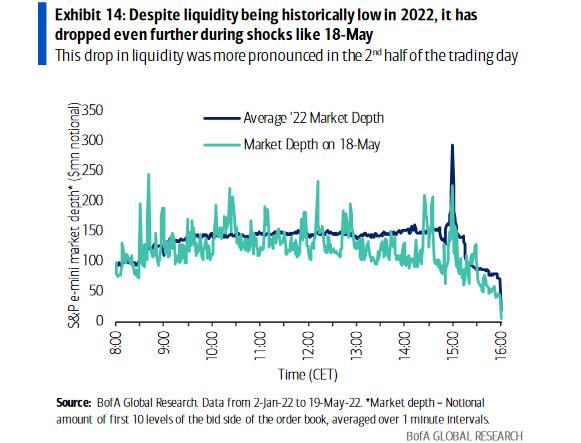
... indicates that such risk may be closer than the relatively orderly pace of the YTD selloff may suggest.
And in fact 85% of the Fed’s dovish turns in the last 50yrs were preceded by less volatile equity selloffs than today’s.
In other words, while the Fed may need a lower inflation and higher unemployment print to greenlight a dovish pivot, one which will send high beta growth names and cryptos limit up in milliseconds, the actual catalyst that prompts the Fed's capitulation may simply be a market crash which the illiquidty in the market accelerates to the point where not even the Fed will be able to ignore what is going on.
One final, important point, according to the BofA strategists: the Fed pivoting to rescue markets may not crush volatility or create a sustained rebound back to new highs, as the 2013, 2015, and 2018 pivots did. If inflation remains a pressing concern, a Fed intervention may only bring temporary relief to risk assets.
Despite the lack of a Fed capitulation so far, BofA believes markets will continue to test the Fed put, but they caution that it will take more market panic for the Fed to start panicking. To hedge this event, BofA's derivatives traders like owning local SPX skew near 10yr lows through Dec put ratios. The trade is designed for a tail event in which markets test the Fed put and find that it’s heavily compromised in the face of inflation. As one example, consider selling 1x SPX Dec 4050 put to buy 2.5x of the Dec 3500 put for an upfront debit of ~1% (ref. 3973.75). More details on this highly convex trade in the full BofA note available to pro subscribers.
Despite the market’s long-overdue rebound after a near-record 7 consecutive down weeks for the S&P (a 20yr record), the Fed has so far offered no help to risk assets and appears far from stepping in or triggering the elusive “Fed Put”. This is despite, as BofA’s Gonzalo Aziz warns in the bank’s latest Global Equity Volatility Insights note (available to pro subs), risks building in financial markets to an extent that central banks wouldn’t have allowed in years past.
Indeed, as we observed recently (see “When Will The Fed Capitulate And Stop Hiking: Finally Some Good News For The Bulls“), credit spreads, historically the most reliable predictor of Fed interventions, have reached levels of prior Fed rescues. Furthermore, over 85% of dovish Fed turns in the last 50yrs were preceded by less volatile equity selloffs than today’s. And as we highlight virtually every day, S&P futures liquidity has only been worse in the depths of the GFC and the Covid shock, adding to fragility risk and the potential the Fed put is tested in a dysfunctional market.
And yet, despite all these growing risk-factors, so far Powell has ignored all appeals for help from the market. Of course, no matter how hard the US central bank may try to signal otherwise, the Fed put isn’t fully gone, and it will likely be tested, as it has repeatedly since Greenspan gave birth to it in 1987.
So what signposts should investors watch to know when the Fed put’s strike is near? According to Bank of America there are key indicators to keep an eye on:
1. Credit stress: We have discussed before that credit stress has been the most consistent predictor of dovish Fed pivots in the last 10yrs, particularly stress in Investment Grade bonds (which have historically used by companies to fund buybacks, if not so much capex). This is notable because CDX IG spreads are near those key levels now, but the Fed’s focus on inflation means spreads are likely to widen further before triggering a policy response.
2. S&P drawdown: Perhaps just as important as nascent credit stress, the size of the equity drawdown from all-time highs has according to BofA become an important signal for investors looking to buy the dip in recent years. However, while this may have worked relatively well in the era of high Fed sensitivity to markets, it has been a much less reliable predictor of dovish Fed turns over a longer history. As chart 10 shows, the Fed has either stopped hiking or begun cutting rates during S&P drawdowns of very different magnitudes – from as low as 2-3% in the mid-1990s to over 30% in ‘75 and ‘87.
3. Economic data: Economic data is of course critical to the Fed’s reaction function, and a sustained cooling of inflationary pressures is arguably the data point most likely to slow their tightening plans (something we expect is gradually taking place now and will become manifest at the Jackson Hole PivotTM). Indeed, BofA’s rates team’s 20-May Global Rates Weekly argues that a Fed pivot requires a meaningful slowdown in job market data. However, that type of data is much slower-moving, and it would take several months or quarters to convince the Fed that a dangerous inflationary spiral has been averted. On the other hand, as PIper Sandler quantified recent layoff announcements, it is clear that mass layoffs have begun, and the bank expects “a million layoffs or more” which will be more than sufficient to force the Fed to pivot.

4. Market dysfunction: While all of the above are certainly important catalysts for the Fed to “panic” and go into full-blown Fed Put mode, BofA’s derivatives traders believe that an episode of market dysfunction is the most likely trigger for central banks, or as they quote us (quoting BofA’s Michael Hartnett), “markets stop panicking when central banks start panicking”, but today it will take more market panic for the Fed to start panicking.
So are we there yet? Not quite, but getting closer. The near-record low liquidity in equity futures (a key feature of fragility shocks) which we highlight virtually every day…

… indicates that such risk may be closer than the relatively orderly pace of the YTD selloff may suggest.

And in fact 85% of the Fed’s dovish turns in the last 50yrs were preceded by less volatile equity selloffs than today’s.

In other words, while the Fed may need a lower inflation and higher unemployment print to greenlight a dovish pivot, one which will send high beta growth names and cryptos limit up in milliseconds, the actual catalyst that prompts the Fed’s capitulation may simply be a market crash which the illiquidty in the market accelerates to the point where not even the Fed will be able to ignore what is going on.
One final, important point, according to the BofA strategists: the Fed pivoting to rescue markets may not crush volatility or create a sustained rebound back to new highs, as the 2013, 2015, and 2018 pivots did. If inflation remains a pressing concern, a Fed intervention may only bring temporary relief to risk assets.
Despite the lack of a Fed capitulation so far, BofA believes markets will continue to test the Fed put, but they caution that it will take more market panic for the Fed to start panicking. To hedge this event, BofA’s derivatives traders like owning local SPX skew near 10yr lows through Dec put ratios. The trade is designed for a tail event in which markets test the Fed put and find that it’s heavily compromised in the face of inflation. As one example, consider selling 1x SPX Dec 4050 put to buy 2.5x of the Dec 3500 put for an upfront debit of ~1% (ref. 3973.75). More details on this highly convex trade in the full BofA note available to pro subscribers.