Authored by Charles Hugh Smith via OfTwoMinds blog,
Politically, what's the easier play: cut entitlements, the vast majority of which flow to the bottom 90%, or "claw back" the ill-gotten gains of the top 1%?\
Since we're discussing wealth, income and taxes, let's stipulate a few things at the start:
1. The households with the highest incomes pay the majority of federal taxes. The top 1% collected 22% of all income and paid 45% of personal federal income taxes.
The top 10% earned about 50% of all income and paid 74% of personal federal income taxes. The bottom 50% earned 10% of total income and paid 2% of income taxes. Tax Shares in Tax Year 2020.
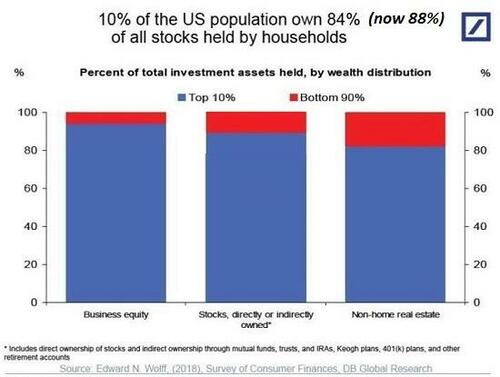
2. This reflects the reality that income and wealth are highly concentrated in the top households in the U.S. I posted the Federal Reserve charts here: How Great Is Our Economy If the Bottom 50%'s Share of the Nation's Wealth Has Plummeted Since 2009?. The bottom 50% own 2.3% of financial assets, the top 1% own 35.3% of financial assets. As this chart shows, the top 10% own the vast majority of income-producing assets: stocks and bonds, business equity and rental income property:
3. The biggest tax burden for most of the bottom 75% is Social Security / Medicare taxes paid out of wages. Earnings above $160,200 are not subject to Social Security tax.
4. The wealthy have tax break strategies that are unavailable to the middle class. One common strategy is to borrow living expenses rather than sell assets that would generate capital gains and thus capital gains taxes. The wealthy can live on borrowed money and thus declare no income and pay no taxes. ProPublica Shows How Little the Wealthiest Pay in Taxes: Policymakers Should Respond Accordingly.
5. Capital gains are highly contentrated in the top 1% of households, who received 75% of the taxable long-term capital gains. The top capital gains tax rate is 20% (plus 3.8% above $200,000, for a maximum of 23.8%), while the top rate for earned income is 37%. Source).
The Distribution of Household Income. (CBO)
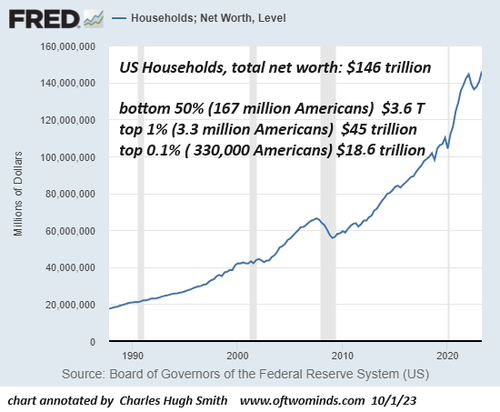
6. Total household net worth is about $146 trillion. Total personal income in the US is around $22 trillion annually.
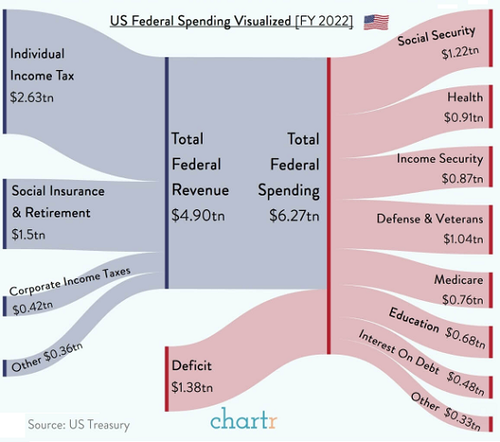
7. The federal budget was $6.3 trillion in 2022, of which $1.4 trillion was borrowed (i.e. deficit spending).
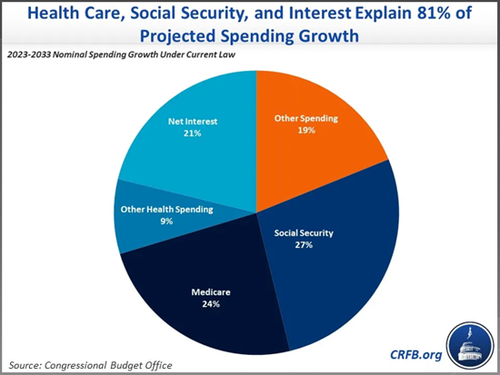
Roughly 80% of the projected future growth of federal spending is mandatory spending on entitlements and interest due on the federal debt:
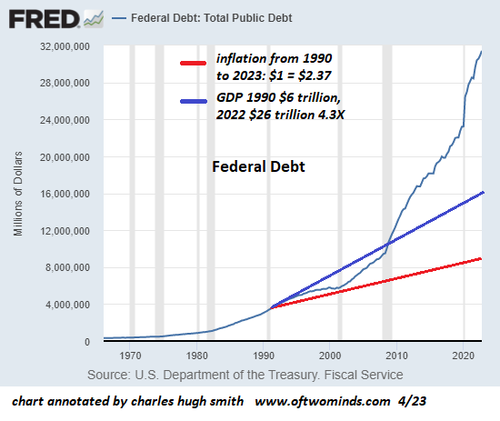
8. Federal debt is $33 trillion and rising at a parabolic rate far above the rate of GDP growth or inflation.
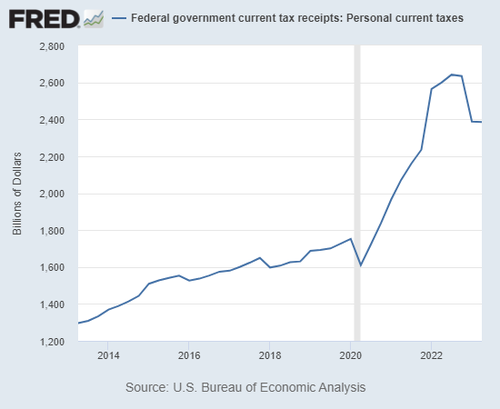
9. Personal income taxes collected rose sharply since 2020, from $1.6 trillion to $2.4 trillion. Per the above data, the majority of the higher tax revenues were paid by the top earners / those declaring capital gains.
Putting this together:
A. Federal spending will continue to rise sharply for decades to fund soaring Social Security, Medicare / Medicaid entitlements and the fast-rising interest due on skyrocketing federal debt, much of which is borrowed at much higher rates than in the recent past.
B. Borrowing tens of trillions of dollars of additional debt that accrues interest is not viable unless tax revenues rise substantially to pay the higher interest costs and reduce the sums that must be borrowed.
C. The bottom 75% have very limited wiggle-room to pay higher taxes. They're struggling to pay the rising cost of living as it is. They pay 11% of income taxes, any tax increases on these 100 million households will not yield enough to make it worth the political risk.
D. The 20 million upper-middle class households between 75% and the 90% pay about 15% of federal income taxes. They can be squeezed for a bit more, but since they don't own much in the way of income-producing wealth, there's not much potential to raise serious sums from this cohort.
E. The only real potential for raising additional tax revenues is in the top 10% who own roughly 90% of all income-producing wealth. And since this ownership of income / capital gains-yielding assets is concentrated in the top 5%, that's the only deep-pocketed source of consequentially higher tax revenues that can be tapped.
Many people are concerned that the IRS will blanket the nation with tax audits aimed at the middle class. I tend to think this is unlikely because the middle class has so few dodgy tax strategies. Auditing the bottom 75% is a waste of time, as their income and tax rates are so low that whatever could be skimmed isn't worth the effort.
Even upper-middle class income is mostly earned, and there's simply not much the average upper-middle class household can do to limit their tax burden, other than save money in self-directed 401K retirement plans and similar transparent strategies.
To really raise tax revenues, regulations / tax laws will have to change to close the loopholes used by the top 1% and top 0.1%. Given that much of this wealth / income is unearned, i.e. the happy result of debt-based asset bubbles in income-producing assets, then closing loopholes that are unavailable to the merely wealthy will likely be framed as "clawing back" income that evaded the taxes paid by the merely wealthy and upper middle class.
Politically, what's the easier play: cut entitlements, the vast majority of which flow to the bottom 90%, or "claw back" the ill-gotten gains of the top 1%?. Which one is more likely to be popular with voters? Yes, the top 0.1% fund the campaigns, but political survival will demand adjustments in what's possible and what's impossible.
Is a 70% Consumption Economy Sustainable? (43:53 min).
* * *
My new book is now available at a 10% discount ($8.95 ebook, $18 print): Self-Reliance in the 21st Century. Read the first chapter for free (PDF)
Authored by Charles Hugh Smith via OfTwoMinds blog,
Politically, what’s the easier play: cut entitlements, the vast majority of which flow to the bottom 90%, or “claw back” the ill-gotten gains of the top 1%?\
Since we’re discussing wealth, income and taxes, let’s stipulate a few things at the start:
1. The households with the highest incomes pay the majority of federal taxes. The top 1% collected 22% of all income and paid 45% of personal federal income taxes.
The top 10% earned about 50% of all income and paid 74% of personal federal income taxes. The bottom 50% earned 10% of total income and paid 2% of income taxes. Tax Shares in Tax Year 2020.
2. This reflects the reality that income and wealth are highly concentrated in the top households in the U.S. I posted the Federal Reserve charts here: How Great Is Our Economy If the Bottom 50%’s Share of the Nation’s Wealth Has Plummeted Since 2009?. The bottom 50% own 2.3% of financial assets, the top 1% own 35.3% of financial assets. As this chart shows, the top 10% own the vast majority of income-producing assets: stocks and bonds, business equity and rental income property:
3. The biggest tax burden for most of the bottom 75% is Social Security / Medicare taxes paid out of wages. Earnings above $160,200 are not subject to Social Security tax.
4. The wealthy have tax break strategies that are unavailable to the middle class. One common strategy is to borrow living expenses rather than sell assets that would generate capital gains and thus capital gains taxes. The wealthy can live on borrowed money and thus declare no income and pay no taxes. ProPublica Shows How Little the Wealthiest Pay in Taxes: Policymakers Should Respond Accordingly.
5. Capital gains are highly contentrated in the top 1% of households, who received 75% of the taxable long-term capital gains. The top capital gains tax rate is 20% (plus 3.8% above $200,000, for a maximum of 23.8%), while the top rate for earned income is 37%. Source).
The Distribution of Household Income. (CBO)
6. Total household net worth is about $146 trillion. Total personal income in the US is around $22 trillion annually.
7. The federal budget was $6.3 trillion in 2022, of which $1.4 trillion was borrowed (i.e. deficit spending).
Roughly 80% of the projected future growth of federal spending is mandatory spending on entitlements and interest due on the federal debt:
8. Federal debt is $33 trillion and rising at a parabolic rate far above the rate of GDP growth or inflation.
9. Personal income taxes collected rose sharply since 2020, from $1.6 trillion to $2.4 trillion. Per the above data, the majority of the higher tax revenues were paid by the top earners / those declaring capital gains.
Putting this together:
A. Federal spending will continue to rise sharply for decades to fund soaring Social Security, Medicare / Medicaid entitlements and the fast-rising interest due on skyrocketing federal debt, much of which is borrowed at much higher rates than in the recent past.
B. Borrowing tens of trillions of dollars of additional debt that accrues interest is not viable unless tax revenues rise substantially to pay the higher interest costs and reduce the sums that must be borrowed.
C. The bottom 75% have very limited wiggle-room to pay higher taxes. They’re struggling to pay the rising cost of living as it is. They pay 11% of income taxes, any tax increases on these 100 million households will not yield enough to make it worth the political risk.
D. The 20 million upper-middle class households between 75% and the 90% pay about 15% of federal income taxes. They can be squeezed for a bit more, but since they don’t own much in the way of income-producing wealth, there’s not much potential to raise serious sums from this cohort.
E. The only real potential for raising additional tax revenues is in the top 10% who own roughly 90% of all income-producing wealth. And since this ownership of income / capital gains-yielding assets is concentrated in the top 5%, that’s the only deep-pocketed source of consequentially higher tax revenues that can be tapped.
Many people are concerned that the IRS will blanket the nation with tax audits aimed at the middle class. I tend to think this is unlikely because the middle class has so few dodgy tax strategies. Auditing the bottom 75% is a waste of time, as their income and tax rates are so low that whatever could be skimmed isn’t worth the effort.
Even upper-middle class income is mostly earned, and there’s simply not much the average upper-middle class household can do to limit their tax burden, other than save money in self-directed 401K retirement plans and similar transparent strategies.
To really raise tax revenues, regulations / tax laws will have to change to close the loopholes used by the top 1% and top 0.1%. Given that much of this wealth / income is unearned, i.e. the happy result of debt-based asset bubbles in income-producing assets, then closing loopholes that are unavailable to the merely wealthy will likely be framed as “clawing back” income that evaded the taxes paid by the merely wealthy and upper middle class.
Politically, what’s the easier play: cut entitlements, the vast majority of which flow to the bottom 90%, or “claw back” the ill-gotten gains of the top 1%?. Which one is more likely to be popular with voters? Yes, the top 0.1% fund the campaigns, but political survival will demand adjustments in what’s possible and what’s impossible.
Is a 70% Consumption Economy Sustainable? (43:53 min).
* * *
My new book is now available at a 10% discount ($8.95 ebook, $18 print): Self-Reliance in the 21st Century. Read the first chapter for free (PDF)
Loading…
