Authored by Jesse Colombo via Substack
For most investors, gold and silver are inseparable, like peanut butter and jelly or two peas in a pod. This mindset leads them to look at gold for signals on silver’s future price movements, and vice versa. Although silver’s price is indeed strongly influenced by gold, few realize the significant role that copper also plays in shaping silver’s price movements. In this article, I’ll examine how copper prices impact silver and show how bullish trends in copper should help drive silver prices higher in the coming years.
To understand the price relationship between two assets, examining their correlations can be highly insightful. Not surprisingly, gold and silver exhibit a strong correlation—.771 over the past five years and an even higher .917 over the past year. What's particularly striking, however, is the strong correlation between copper and silver—.725 over the past five years and an impressive .878 over the past year. This strong correlation is a compelling reason for silver investors to monitor copper as closely as they do gold.
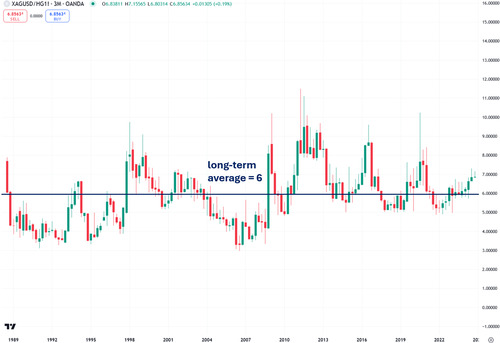
The strong price relationship between silver and copper is clearly reflected in long-term charts of the silver-to-copper ratio, which has remained remarkably consistent over time, despite periodic fluctuations around the average of 6:
The close relationship between silver and copper can be attributed to factors influencing both supply and demand. From a supply standpoint, silver is seldom mined on its own. Instead, it is typically a byproduct of copper and other metal mining, such as lead, zinc, and gold. On the demand side, both silver and copper have substantial industrial applications, driving significant industrial demand for both metals.
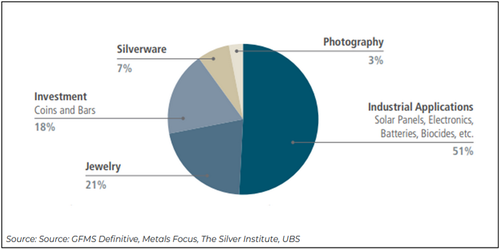
While silver is often grouped with gold, it differs significantly in its demand profile. The majority of silver demand (51%) comes from industrial use, compared to just 18% from investment. Furthermore, the rapid growth in industrial demand for silver likely explains the rising correlation between silver and copper in recent years. In contrast, gold demand is largely fueled by investment (44.57%) and jewelry (48.74%)—with much of that jewelry also serving as a form of investment, especially in developing countries like India and China.
Both copper and silver are far more sensitive to the economic cycle compared to gold. For instance, when a recession looms, both copper and silver prices tend to decline in anticipation of reduced industrial demand. Conversely, when the economic cycle is on an upswing, both copper and silver prices typically rise in anticipation of increased industrial demand. Gold, by contrast, is traditionally viewed as a safe-haven asset that investors turn to during times of crisis.
The strong price relationship between silver and copper is likely amplified by trading algorithms that predict movements in one metal based on the price of the other, often creating a self-fulfilling prophecy. For instance, when copper begins to rally, certain algorithms will buy silver, causing both metals to rise in tandem. Although anecdotal, I’ve often observed silver track copper even more closely than gold, both on intraday movements and over longer timeframes. For instance, I’ve often seen silver rise with copper while gold stayed flat or declined, and at other times, I’ve observed silver dropping along with copper even as gold rallied. I’ll highlight a recent noteworthy example of this phenomenon using the charts below.
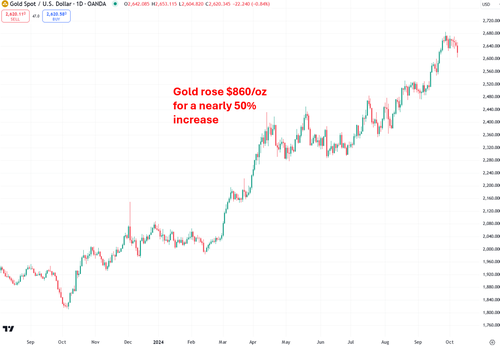
As you are probably aware, gold has experienced a remarkable surge over the past year, climbing by $860 per ounce—a nearly 50% increase:
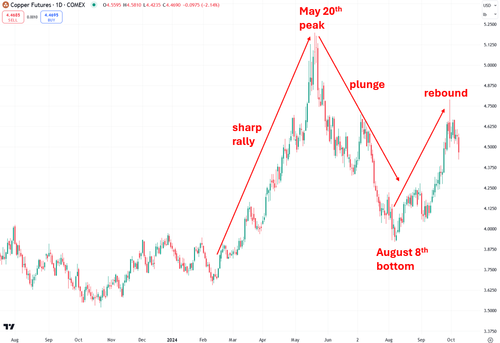
Like gold, copper experienced a strong rally in the spring, but it peaked on May 20th and quickly reversed, wiping out most of its gains—unlike gold, which continued to rise. Copper bottomed on August 8th and has rebounded quite a bit since then and is now in a confirmed uptrend once again:
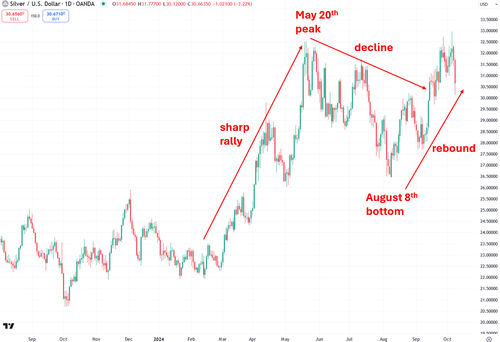
Finally, we come to silver, which, like gold and copper, saw a sharp rally in the spring. Like copper, silver peaked on May 20th and experienced a sharp decline, though not as severe as copper's drop. While silver and copper suffered throughout the summer, gold steadily continued its ascent. Silver, like copper, bottomed on August 8th and has been staging an impressive recovery ever since.
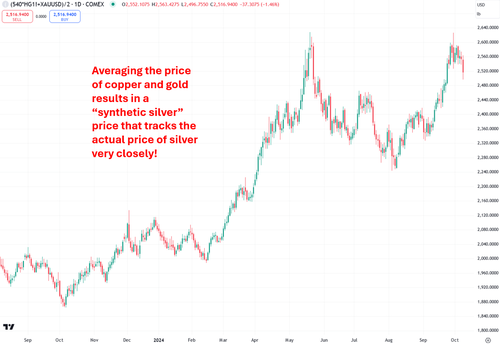
Silver's price movements are essentially a hybrid of both gold and copper's market trends. To test this theory, I averaged the prices of gold and copper, adjusting copper’s price (by multiplying by 540) to prevent gold’s higher price from exerting undue influence. Then, I created a chart based on that adjusted average. Sure enough, the resulting chart bears a striking resemblance to silver's price chart:
Moreover, the five-year correlation with silver stands at a solid 0.842, while the one-year correlation is an even more impressive 0.956. This is higher than the correlation between gold and silver (0.771 over five years and 0.917 over the past year) and even stronger than the correlation between copper and silver (0.725 over five years and 0.878 over the past year). This analysis highlights the importance of monitoring both gold and copper to gain a clearer understanding of silver's price movements. In addition, performing technical analysis on the chart of the copper-gold average seems to be a useful tool for confirming and anticipating silver's price movements
Along with bullish technicals, copper's fundamentals also point to a positive outlook. As the world increasingly embraces AI and “green” technologies such as electric vehicles, solar energy, and wind farms, demand for copper is expected to surge due to its essential role in wiring and other electrical applications.
For example, copper demand in the transport sector is expected to rise 11.1 times by 2050 compared to 2022, thanks to electric vehicles that contain over a mile of copper wiring. Additionally, demand for copper to expand the global electricity grid is projected to increase 4.8 times by 2050. By 2030, a copper supply gap nearing 10 million tonnes is forecasted. French billionaire and commodities trader Pierre Andurand recently predicted that copper prices could soar to $40,000 per tonne in the coming years—a more than fourfold increase from the current price of $9,308 per tonne. All of these factors should be bullish for both silver and copper.
In conclusion, the overlooked relationship between copper and silver plays a critical role in understanding silver’s price movements, alongside the more commonly recognized influence of gold. As copper continues to rebound, both technical and fundamental factors suggest that silver is poised to benefit as well. With increasing industrial demand, especially in sectors like electric vehicles and renewable energy, copper’s expected boom is likely to drive silver prices higher as well. Investors would do well to monitor copper closely, as its future movements may signal the next major leg up in silver's bull market.
Also watch the video presentation about this concept:
If you enjoyed this article, please visit Jesse's Substack for more content like this
Authored by Jesse Colombo via Substack
For most investors, gold and silver are inseparable, like peanut butter and jelly or two peas in a pod. This mindset leads them to look at gold for signals on silver’s future price movements, and vice versa. Although silver’s price is indeed strongly influenced by gold, few realize the significant role that copper also plays in shaping silver’s price movements. In this article, I’ll examine how copper prices impact silver and show how bullish trends in copper should help drive silver prices higher in the coming years.
To understand the price relationship between two assets, examining their correlations can be highly insightful. Not surprisingly, gold and silver exhibit a strong correlation—.771 over the past five years and an even higher .917 over the past year. What’s particularly striking, however, is the strong correlation between copper and silver—.725 over the past five years and an impressive .878 over the past year. This strong correlation is a compelling reason for silver investors to monitor copper as closely as they do gold.
The strong price relationship between silver and copper is clearly reflected in long-term charts of the silver-to-copper ratio, which has remained remarkably consistent over time, despite periodic fluctuations around the average of 6:
The close relationship between silver and copper can be attributed to factors influencing both supply and demand. From a supply standpoint, silver is seldom mined on its own. Instead, it is typically a byproduct of copper and other metal mining, such as lead, zinc, and gold. On the demand side, both silver and copper have substantial industrial applications, driving significant industrial demand for both metals.
While silver is often grouped with gold, it differs significantly in its demand profile. The majority of silver demand (51%) comes from industrial use, compared to just 18% from investment. Furthermore, the rapid growth in industrial demand for silver likely explains the rising correlation between silver and copper in recent years. In contrast, gold demand is largely fueled by investment (44.57%) and jewelry (48.74%)—with much of that jewelry also serving as a form of investment, especially in developing countries like India and China.
Both copper and silver are far more sensitive to the economic cycle compared to gold. For instance, when a recession looms, both copper and silver prices tend to decline in anticipation of reduced industrial demand. Conversely, when the economic cycle is on an upswing, both copper and silver prices typically rise in anticipation of increased industrial demand. Gold, by contrast, is traditionally viewed as a safe-haven asset that investors turn to during times of crisis.
The strong price relationship between silver and copper is likely amplified by trading algorithms that predict movements in one metal based on the price of the other, often creating a self-fulfilling prophecy. For instance, when copper begins to rally, certain algorithms will buy silver, causing both metals to rise in tandem. Although anecdotal, I’ve often observed silver track copper even more closely than gold, both on intraday movements and over longer timeframes. For instance, I’ve often seen silver rise with copper while gold stayed flat or declined, and at other times, I’ve observed silver dropping along with copper even as gold rallied. I’ll highlight a recent noteworthy example of this phenomenon using the charts below.
As you are probably aware, gold has experienced a remarkable surge over the past year, climbing by $860 per ounce—a nearly 50% increase:
Like gold, copper experienced a strong rally in the spring, but it peaked on May 20th and quickly reversed, wiping out most of its gains—unlike gold, which continued to rise. Copper bottomed on August 8th and has rebounded quite a bit since then and is now in a confirmed uptrend once again:
Finally, we come to silver, which, like gold and copper, saw a sharp rally in the spring. Like copper, silver peaked on May 20th and experienced a sharp decline, though not as severe as copper’s drop. While silver and copper suffered throughout the summer, gold steadily continued its ascent. Silver, like copper, bottomed on August 8th and has been staging an impressive recovery ever since.
Silver’s price movements are essentially a hybrid of both gold and copper’s market trends. To test this theory, I averaged the prices of gold and copper, adjusting copper’s price (by multiplying by 540) to prevent gold’s higher price from exerting undue influence. Then, I created a chart based on that adjusted average. Sure enough, the resulting chart bears a striking resemblance to silver’s price chart:
Moreover, the five-year correlation with silver stands at a solid 0.842, while the one-year correlation is an even more impressive 0.956. This is higher than the correlation between gold and silver (0.771 over five years and 0.917 over the past year) and even stronger than the correlation between copper and silver (0.725 over five years and 0.878 over the past year). This analysis highlights the importance of monitoring both gold and copper to gain a clearer understanding of silver’s price movements. In addition, performing technical analysis on the chart of the copper-gold average seems to be a useful tool for confirming and anticipating silver’s price movements
Along with bullish technicals, copper’s fundamentals also point to a positive outlook. As the world increasingly embraces AI and “green” technologies such as electric vehicles, solar energy, and wind farms, demand for copper is expected to surge due to its essential role in wiring and other electrical applications.
For example, copper demand in the transport sector is expected to rise 11.1 times by 2050 compared to 2022, thanks to electric vehicles that contain over a mile of copper wiring. Additionally, demand for copper to expand the global electricity grid is projected to increase 4.8 times by 2050. By 2030, a copper supply gap nearing 10 million tonnes is forecasted. French billionaire and commodities trader Pierre Andurand recently predicted that copper prices could soar to $40,000 per tonne in the coming years—a more than fourfold increase from the current price of $9,308 per tonne. All of these factors should be bullish for both silver and copper.
In conclusion, the overlooked relationship between copper and silver plays a critical role in understanding silver’s price movements, alongside the more commonly recognized influence of gold. As copper continues to rebound, both technical and fundamental factors suggest that silver is poised to benefit as well. With increasing industrial demand, especially in sectors like electric vehicles and renewable energy, copper’s expected boom is likely to drive silver prices higher as well. Investors would do well to monitor copper closely, as its future movements may signal the next major leg up in silver’s bull market.
Also watch the video presentation about this concept:
[embedded content]
If you enjoyed this article, please visit Jesse’s Substack for more content like this
Loading…
