Authored by Law Ka-chung via The Epoch Times,
We have been emphasizing here that the yield curve is a very powerful predictor of recession, that whenever a three-month yield (on Bonds) is lower than that of a ten-year by over 50 basis points (bps) or for over two months, the inversion is deemed reliable.

Months ago, the inversion reached 200 bps, implying an almost 80 percent chance of recession ahead. Such a strong signal has not been seen for over four decades since the early 1980s. However, there is a long gap from the beginning of inversion to the start of a recession, usually in the range of four to six quarters with a mean of five.
Instead of blindly believing such a time gap, one school suggests inversion is due much more to policy rate hikes than long-tenor yield movement under market forces. In other words, yield curve inversion predicting a recession is somehow equivalent to a rate hike causing a recession.
Coincidentally, the usual time needed for a rate hike to be effective is roughly four to six quarters, which is pretty much the same time gap between yield curve inversion and recession realization. This round, the inversion was first seen last November, implying recession should now begin.
Despite a recession is usually not known until happens, there are usually some signs. Specifically, lending growth has already been much weaker than before under high interest rates.
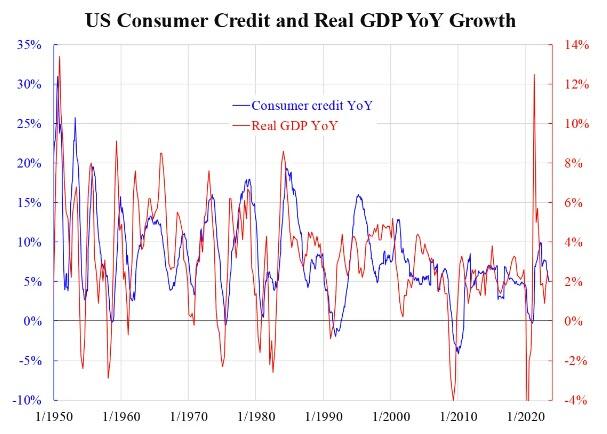
The attached chart compares U.S. consumer credit and real GDP year-over-year (YoY) growth. They have co-moved almost since the beginning of records. Although consumption is regarded as important for its largest share of GDP, it is not in terms of growth. Consumption growth is well-known to be low and stable, which is human nature. Instead, other components are the drivers.
(KC Law, Ka Chung)
As a growth driver, investment ranks higher than output, which is higher than consumption. In equilibrium, they grow at the same rate, but their volatilities differ. In the long run, production equals consumption but the former is not as smooth as the latter. For example, agricultural crops are harvested only once or twice a year but people eat every day. Investment is producing future output, which is even more volatile by definition. It is the volatility that drives the growth during a boom period, and similarly drives the contraction during the bust. This applies everywhere.
Knowing all these, it will be relatively easy to judge the cycle status by looking at the investment type data. The famous candidates are the housing-related ones, but these are sector-specific and may not represent the overall economy. By contrast, consumption credit is a leveraged indicator of consumption having an investment nature. Since the series is, in principle, about consumption, the shape is smoother than GDP, as is seen from the chart. Its declining trend confirms the slowdown without too much lag, thanks to its monthly released frequency.
Once this loop of borrow to consume stops, the growth of other areas could cool down quickly. In one to two quarters ahead or five to six quarters since the yield curve inversion, the tightening effect will be more vividly seen in broader areas, which will define the beginning of the recession.
Authored by Law Ka-chung via The Epoch Times,
We have been emphasizing here that the yield curve is a very powerful predictor of recession, that whenever a three-month yield (on Bonds) is lower than that of a ten-year by over 50 basis points (bps) or for over two months, the inversion is deemed reliable.

Months ago, the inversion reached 200 bps, implying an almost 80 percent chance of recession ahead. Such a strong signal has not been seen for over four decades since the early 1980s. However, there is a long gap from the beginning of inversion to the start of a recession, usually in the range of four to six quarters with a mean of five.
Instead of blindly believing such a time gap, one school suggests inversion is due much more to policy rate hikes than long-tenor yield movement under market forces. In other words, yield curve inversion predicting a recession is somehow equivalent to a rate hike causing a recession.
Coincidentally, the usual time needed for a rate hike to be effective is roughly four to six quarters, which is pretty much the same time gap between yield curve inversion and recession realization. This round, the inversion was first seen last November, implying recession should now begin.
Despite a recession is usually not known until happens, there are usually some signs. Specifically, lending growth has already been much weaker than before under high interest rates.
The attached chart compares U.S. consumer credit and real GDP year-over-year (YoY) growth. They have co-moved almost since the beginning of records. Although consumption is regarded as important for its largest share of GDP, it is not in terms of growth. Consumption growth is well-known to be low and stable, which is human nature. Instead, other components are the drivers.

(KC Law, Ka Chung)
As a growth driver, investment ranks higher than output, which is higher than consumption. In equilibrium, they grow at the same rate, but their volatilities differ. In the long run, production equals consumption but the former is not as smooth as the latter. For example, agricultural crops are harvested only once or twice a year but people eat every day. Investment is producing future output, which is even more volatile by definition. It is the volatility that drives the growth during a boom period, and similarly drives the contraction during the bust. This applies everywhere.
Knowing all these, it will be relatively easy to judge the cycle status by looking at the investment type data. The famous candidates are the housing-related ones, but these are sector-specific and may not represent the overall economy. By contrast, consumption credit is a leveraged indicator of consumption having an investment nature. Since the series is, in principle, about consumption, the shape is smoother than GDP, as is seen from the chart. Its declining trend confirms the slowdown without too much lag, thanks to its monthly released frequency.
Once this loop of borrow to consume stops, the growth of other areas could cool down quickly. In one to two quarters ahead or five to six quarters since the yield curve inversion, the tightening effect will be more vividly seen in broader areas, which will define the beginning of the recession.
Loading…