After yesterday's face-ripping, short-squeezing meltup after Powell's "more dovish than expected" speech which saw the S&P close above the 200DMA for the first time since April, any commentators were quick to opine that Christmas came early for stocks. But did it, and did the ramp on the last day of November simply pull forward what is traditionally a much more gradual December meltup?
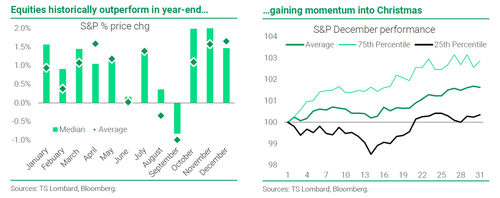
As TS Lombard's Skylar Montgomery Koning explains in a lengthy note from Wednesday, "historically equities outperform into year-end." In the chart on the bottom left, she shows average and median S&P changes on a monthly basis vs the 30y comparable – and, indeed, the S&P does tend to outperform in the last three months of the year on both an average and a median basis. As for the December performance specifically, the equity rally does tend to gain momentum in the two weeks before Christmas, which mark a turning point for the bottom 25th percentile (although the December 2018 crash is still vivid for so many traders). So, there is some historical evidence for the Santa rally hypothesis.
However, as Koning observes, "it is important to note, that an observable pattern is worthless unless there is a reasonable explanation."
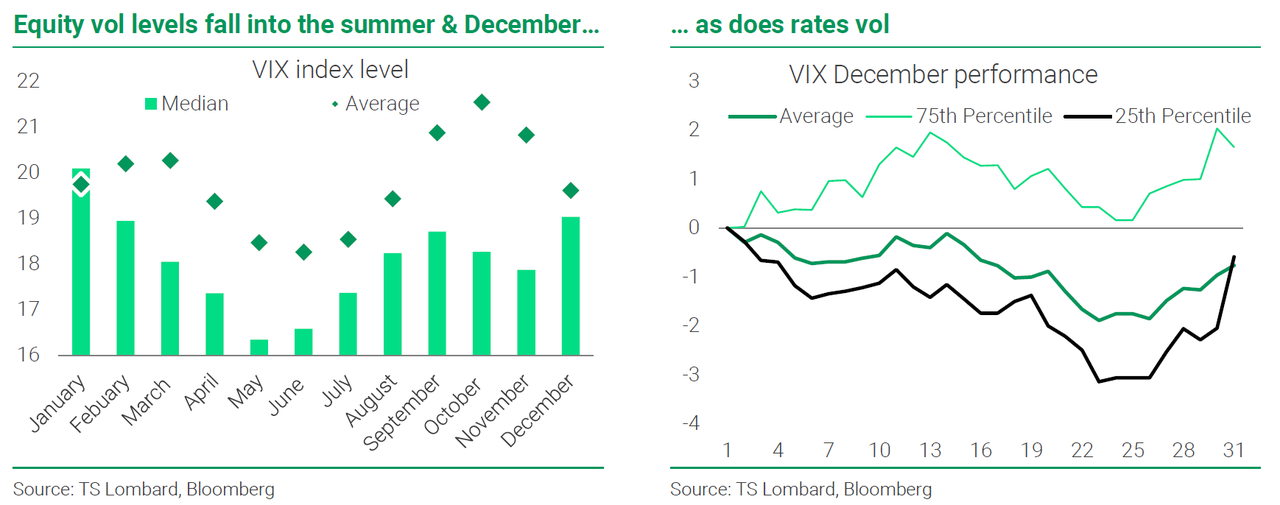
To be sure, there is some logic to seasonality and many touted explanations for the Santa rally exist. For one, risk assets tend to have an inverse relationship with volatility. In this cycle, there has been a tight inverse relationship between rates volatility and equity directionality (see chart on next page bottom left). Of course, since the market has essentially traded a one-factor model (Fed funds expectations) this year, this relationship could be expected; but it also makes sense long term: as Koning notes, "as an investor, I’m much happier allocating to risk assets when they aren’t making 2 standard deviation moves on a regular basis. As market participants go off on holiday, markets close and event risk is limited (i.e., there is less uncertainty), you would expect volatility to fall" which it usually does except in some very high profile cases... such as the unforgettable brief bear market of Dec 2018.
Moreover, over time the bias is for equities to go up: over the S&P’s history, its average return is 7% per annum. In quiet holiday markets without any impetus to the contrary, equities have a bias to revert to trend and grind up. Last week’s Thanksgiving holiday was a case in point: with little on the data front, the US market closed for a day and a half, limited data announcements and many on holiday, market trading was muted, equity volatility fell and equities ground higher. In fact, across DM equity markets, Japan and the United States (both of which have national Thanksgiving holidays) outperform significantly in November.
Volatility does indeed fall into year-end. According to an analysis from the TS Lombard strategists looking at equity vol on a change and level basis historically volatility has fallen going into the summer and Christmas holidays. The net result is lower average vol in the summer and December (see charts below left). And, indeed, we have seen volatility decline across assets from the mid-October peak, although rates and FX vol are still historically elevated.
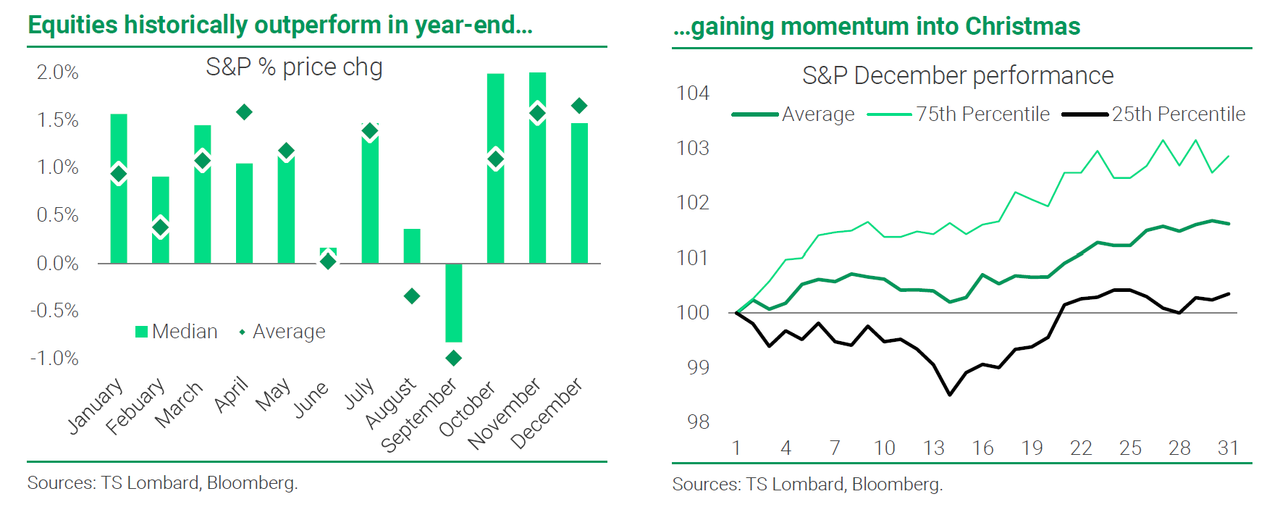
Psychology plays a role. With regard to the end of the year, it is also important to note that money managers are judged on annual calendar year performance. Because of the propensity for equities to rally as the end of the year approaches, investors who have lost money have an incentive to chase the rally upwards, while those who have made money are more likely to settle their books. Or, in a year like 2022, where they have made money by being short risk, with the market rallying, those who have made money buy upside exposure so as not to bleed P&L into year-end. Options data back this up: the CBOE put/call ratio drops significantly in December (i.e., investors want more upside vs downside exposure – see the chart below right).

User Beware – fundamentals dominate. The major point here is that dispersion within months is massive; historically the maximum return observed in October is +11%, while the minimum is -22%. Additionally as shown in the first chart up top, both average and median numbers illustrate that while seasonality can guide returns, a large fundamental force can more than negate it. And a case in point is October, where the average return is significantly below the median. This is because October has had two historical risk asset collapses: Black Monday in 1987, when US equities fell more than 20% in a day; and the Lehman collapse, which took place in mid-September 2008 but the bulk of the equity decline came in October 2008 (-17%). Moreover, there are three stumbling blocks to the Santa rally narrative.
- First: Equity performance already looks overdone. Equities have rallied 10% in the period October-November – the median rally over 4Q is 5.5% (and the average is 4.3%). Additionally, when the S&P rallies above its 50 & 100DMA, it looks technically vulnerable as it heads towards its 200DMA. Moreover, the rally in equities contrasts with the rates volatility rebound on the recent spate of Fed hawkish speak (see the chart on the previous page on the left).
- Second: There is a lot of event risk into year-end. This week alone we will have a key speech from Powell (speaking at the Brookings Institution ahead of the quiet period), US core PCE and a jobs report, followed by an OPEC meeting at the weekend. Then virtually every DM central bank will report over a two-week period. Plus there will be the US CPI one day before the final Fed meeting of the year (on 14 December), where we will get a new set of projections, dots and the markets pivot narrative will be put to the test.
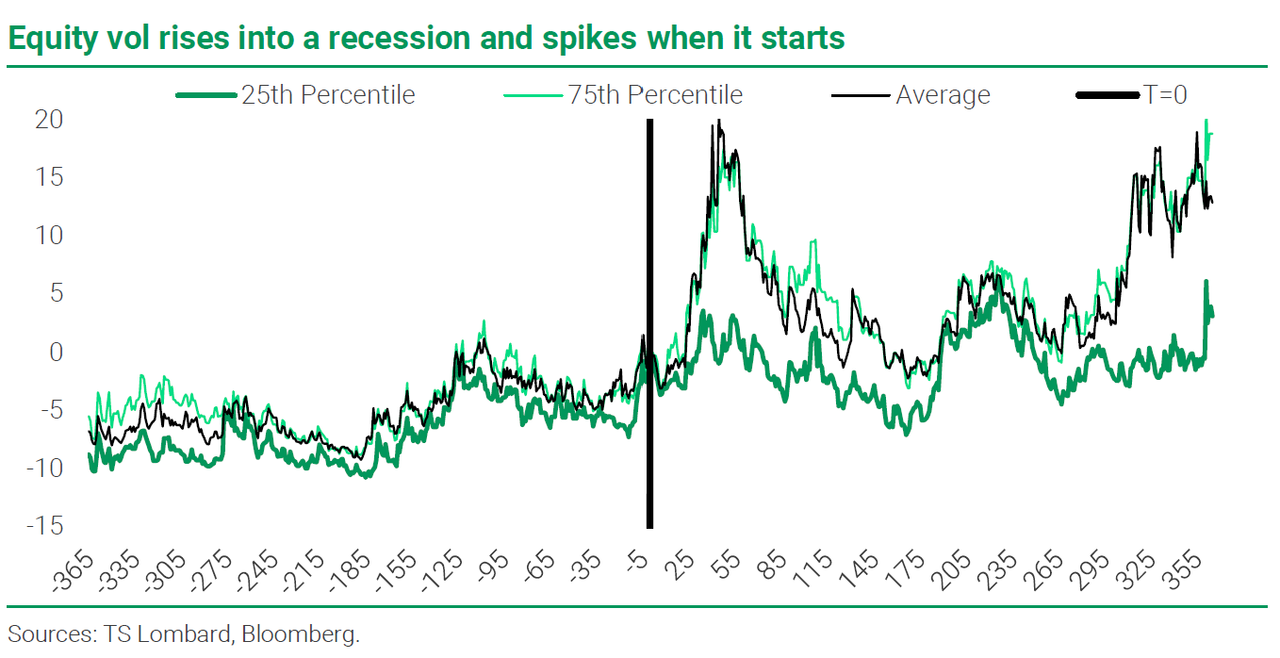
- Third: Recession generally implies lower risk assets and higher volatility. As TS Lombard economists warn, the rates market and economists are telling us we are headed toward a recession – which has been our base case since the summer. We have covered the risk asset implications here. But it is also important to note that as the economy deteriorates into a recession, adverse sentiment kicks in and things tend to become non-linear, accelerating the slowdown. Correspondingly, volatility tends to rise from half a year before the recession begins, spiking at the start of the recession (see chart below).

More in the full note available to pro subs.
After yesterday’s face-ripping, short-squeezing meltup after Powell’s “more dovish than expected” speech which saw the S&P close above the 200DMA for the first time since April, any commentators were quick to opine that Christmas came early for stocks. But did it, and did the ramp on the last day of November simply pull forward what is traditionally a much more gradual December meltup?
As TS Lombard’s Skylar Montgomery Koning explains in a lengthy note from Wednesday, “historically equities outperform into year-end.” In the chart on the bottom left, she shows average and median S&P changes on a monthly basis vs the 30y comparable – and, indeed, the S&P does tend to outperform in the last three months of the year on both an average and a median basis. As for the December performance specifically, the equity rally does tend to gain momentum in the two weeks before Christmas, which mark a turning point for the bottom 25th percentile (although the December 2018 crash is still vivid for so many traders). So, there is some historical evidence for the Santa rally hypothesis.

However, as Koning observes, “it is important to note, that an observable pattern is worthless unless there is a reasonable explanation.”
To be sure, there is some logic to seasonality and many touted explanations for the Santa rally exist. For one, risk assets tend to have an inverse relationship with volatility. In this cycle, there has been a tight inverse relationship between rates volatility and equity directionality (see chart on next page bottom left). Of course, since the market has essentially traded a one-factor model (Fed funds expectations) this year, this relationship could be expected; but it also makes sense long term: as Koning notes, “as an investor, I’m much happier allocating to risk assets when they aren’t making 2 standard deviation moves on a regular basis. As market participants go off on holiday, markets close and event risk is limited (i.e., there is less uncertainty), you would expect volatility to fall” which it usually does except in some very high profile cases… such as the unforgettable brief bear market of Dec 2018.
Moreover, over time the bias is for equities to go up: over the S&P’s history, its average return is 7% per annum. In quiet holiday markets without any impetus to the contrary, equities have a bias to revert to trend and grind up. Last week’s Thanksgiving holiday was a case in point: with little on the data front, the US market closed for a day and a half, limited data announcements and many on holiday, market trading was muted, equity volatility fell and equities ground higher. In fact, across DM equity markets, Japan and the United States (both of which have national Thanksgiving holidays) outperform significantly in November.
Volatility does indeed fall into year-end. According to an analysis from the TS Lombard strategists looking at equity vol on a change and level basis historically volatility has fallen going into the summer and Christmas holidays. The net result is lower average vol in the summer and December (see charts below left). And, indeed, we have seen volatility decline across assets from the mid-October peak, although rates and FX vol are still historically elevated.
Psychology plays a role. With regard to the end of the year, it is also important to note that money managers are judged on annual calendar year performance. Because of the propensity for equities to rally as the end of the year approaches, investors who have lost money have an incentive to chase the rally upwards, while those who have made money are more likely to settle their books. Or, in a year like 2022, where they have made money by being short risk, with the market rallying, those who have made money buy upside exposure so as not to bleed P&L into year-end. Options data back this up: the CBOE put/call ratio drops significantly in December (i.e., investors want more upside vs downside exposure – see the chart below right).
User Beware – fundamentals dominate. The major point here is that dispersion within months is massive; historically the maximum return observed in October is +11%, while the minimum is -22%. Additionally as shown in the first chart up top, both average and median numbers illustrate that while seasonality can guide returns, a large fundamental force can more than negate it. And a case in point is October, where the average return is significantly below the median. This is because October has had two historical risk asset collapses: Black Monday in 1987, when US equities fell more than 20% in a day; and the Lehman collapse, which took place in mid-September 2008 but the bulk of the equity decline came in October 2008 (-17%). Moreover, there are three stumbling blocks to the Santa rally narrative.
- First: Equity performance already looks overdone. Equities have rallied 10% in the period October-November – the median rally over 4Q is 5.5% (and the average is 4.3%). Additionally, when the S&P rallies above its 50 & 100DMA, it looks technically vulnerable as it heads towards its 200DMA. Moreover, the rally in equities contrasts with the rates volatility rebound on the recent spate of Fed hawkish speak (see the chart on the previous page on the left).
- Second: There is a lot of event risk into year-end. This week alone we will have a key speech from Powell (speaking at the Brookings Institution ahead of the quiet period), US core PCE and a jobs report, followed by an OPEC meeting at the weekend. Then virtually every DM central bank will report over a two-week period. Plus there will be the US CPI one day before the final Fed meeting of the year (on 14 December), where we will get a new set of projections, dots and the markets pivot narrative will be put to the test.
- Third: Recession generally implies lower risk assets and higher volatility. As TS Lombard economists warn, the rates market and economists are telling us we are headed toward a recession – which has been our base case since the summer. We have covered the risk asset implications here. But it is also important to note that as the economy deteriorates into a recession, adverse sentiment kicks in and things tend to become non-linear, accelerating the slowdown. Correspondingly, volatility tends to rise from half a year before the recession begins, spiking at the start of the recession (see chart below).
More in the full note available to pro subs.