Life and work in the 21st century is increasingly reliant on modern technology, with a country’s digital quality of life playing a massive role on people’s day-to-day.
Some countries excel in internet access and affordability, while others have more modern digital systems and relevant laws. And, as Visual Capitalist's Omri Wallach details below, many regions of the world suffer with lacking digital infrastructure and access across the board.
The 2022 Digital Quality of Life Index (DQL) from Surfshark analyzes countries on digital wellbeing, based on data from the UN, World Bank, Freedom House, and the International Communications Union.
5 Metrics for Measuring Digital Wellbeing
The DQL Index covers 117 countries with readily available data, making up 92% of the global population. Each country is scored on five pillars:
-
Internet Affordability—How much time people have to work to afford a stable internet connection.
-
Internet Quality—How fast and stable the internet connectivity in a country is and how well it’s improving.
-
Electronic Infrastructure—How well developed and inclusive a country’s existing electronic infrastructure is.
-
Electronic Security—How safe and protected people feel in a country.
-
Electronic Government—How advanced and digitized a country’s government services are.
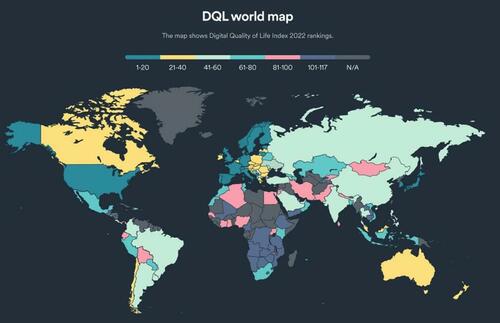
Visualizing The World’s Digital Quality of Life
Overall, Europe and Asia led the digital quality of life rankings in 2022. Israel took the top spot with an incredibly strong score in internet affordability. Here are the countries sorted by rankings and their weighted scores in each category:
| Rank | Country | Affordability | Quality | E-infrastructure | E-security | E-government |
|---|---|---|---|---|---|---|
| 1 | Israel | 0.1917 | 0.0981 | 0.1668 | 0.1503 | 0.1541 |
| 2 | Denmark | 0.047 | 0.1186 | 0.1968 | 0.1878 | 0.1844 |
| 3 | Germany | 0.0718 | 0.0926 | 0.1922 | 0.1946 | 0.1612 |
| 4 | France | 0.0534 | 0.111 | 0.1834 | 0.1878 | 0.1749 |
| 5 | Sweden | 0.0213 | 0.1059 | 0.1958 | 0.1878 | 0.1787 |
| 6 | Netherlands | 0.0241 | 0.0985 | 0.1956 | 0.1865 | 0.1796 |
| 7 | Finland | 0.0171 | 0.0973 | 0.192 | 0.1892 | 0.1869 |
| 8 | Japan | 0.0684 | 0.1024 | 0.1846 | 0.1462 | 0.177 |
| 9 | U.K. | 0.0413 | 0.0898 | 0.1882 | 0.1611 | 0.188 |
| 10 | South Korea | 0.0252 | 0.1139 | 0.1884 | 0.1516 | 0.1868 |
| 11 | Lithuania | 0.0508 | 0.087 | 0.1705 | 0.1973 | 0.1592 |
| 12 | U.S. | 0.0326 | 0.113 | 0.1944 | 0.1224 | 0.1947 |
| 13 | Switzerland | 0.0337 | 0.1114 | 0.1914 | 0.1597 | 0.1607 |
| 14 | Estonia | 0.0219 | 0.0759 | 0.1852 | 0.1946 | 0.1779 |
| 15 | Singapore | 0.0717 | 0.1134 | 0.1852 | 0.0943 | 0.19 |
| 16 | Spain | 0.0257 | 0.0924 | 0.1777 | 0.1919 | 0.1656 |
| 17 | Norway | 0.0136 | 0.0923 | 0.194 | 0.1649 | 0.174 |
| 18 | Luxembourg | 0.0272 | 0.0911 | 0.1878 | 0.1689 | 0.1597 |
| 19 | Italy | 0.0362 | 0.082 | 0.1733 | 0.1824 | 0.159 |
| 20 | Portugal | 0.0085 | 0.1101 | 0.1576 | 0.1932 | 0.1565 |
| 21 | Belgium | 0.0162 | 0.0868 | 0.1823 | 0.1973 | 0.1409 |
| 22 | Austria | 0.0279 | 0.0717 | 0.1782 | 0.1716 | 0.1719 |
| 23 | Poland | 0.0242 | 0.0869 | 0.1566 | 0.1905 | 0.1568 |
| 24 | Ireland | 0.0217 | 0.0874 | 0.1799 | 0.1662 | 0.1596 |
| 25 | Czechia | 0.023 | 0.0755 | 0.1707 | 0.196 | 0.1472 |
| 26 | Canada | 0.0228 | 0.0967 | 0.1831 | 0.1289 | 0.1723 |
| 27 | Hungary | 0.0206 | 0.1046 | 0.1647 | 0.1676 | 0.1425 |
| 28 | New Zealand | 0.0166 | 0.1027 | 0.1731 | 0.1341 | 0.1702 |
| 29 | Slovakia | 0.0233 | 0.0807 | 0.161 | 0.1865 | 0.1417 |
| 30 | Bulgaria | 0.0308 | 0.1025 | 0.1352 | 0.177 | 0.1452 |
| 31 | Croatia | 0.0133 | 0.0911 | 0.1625 | 0.1865 | 0.1346 |
| 32 | Slovenia | 0.0102 | 0.0934 | 0.1619 | 0.1622 | 0.1591 |
| 33 | Latvia | 0.0235 | 0.0918 | 0.1628 | 0.1784 | 0.1289 |
| 34 | Romania | 0.0299 | 0.105 | 0.1427 | 0.1743 | 0.1327 |
| 35 | Australia | 0.0453 | 0.0706 | 0.1755 | 0.1089 | 0.1802 |
| 36 | Malta | 0.0104 | 0.093 | 0.1639 | 0.1527 | 0.1547 |
| 37 | Cyprus | 0.0139 | 0.0718 | 0.1589 | 0.1689 | 0.1548 |
| 38 | Malaysia | 0.0319 | 0.0838 | 0.1636 | 0.1224 | 0.1561 |
| 39 | Greece | 0.0085 | 0.0713 | 0.142 | 0.2 | 0.1344 |
| 40 | Chile | 0.0251 | 0.1202 | 0.1469 | 0.1022 | 0.1538 |
| 41 | Uruguay | 0.0051 | 0.1054 | 0.1569 | 0.13 | 0.1498 |
| 42 | Russia | 0.0556 | 0.0794 | 0.1512 | 0.0943 | 0.152 |
| 43 | China | 0.0241 | 0.1045 | 0.1485 | 0.0741 | 0.175 |
| 44 | U.A.E. | 0.0071 | 0.1148 | 0.1779 | 0.0419 | 0.1712 |
| 45 | Argentina | 0.0073 | 0.0694 | 0.1575 | 0.13 | 0.1464 |
| 46 | Qatar | 0.0077 | 0.1077 | 0.1705 | 0.0808 | 0.1421 |
| 47 | Armenia | 0.1009 | 0.07 | 0.1356 | 0.0765 | 0.1221 |
| 48 | Serbia | 0.0184 | 0.0739 | 0.1387 | 0.1238 | 0.1429 |
| 49 | Thailand | 0.0081 | 0.1045 | 0.151 | 0.0876 | 0.1391 |
| 50 | Ukraine | 0.0259 | 0.0581 | 0.1613 | 0.1184 | 0.1256 |
| 51 | Saudi Arabia | 0.0057 | 0.0873 | 0.1635 | 0.0865 | 0.1408 |
| 52 | Turkey | 0.0153 | 0.0679 | 0.1526 | 0.0968 | 0.1488 |
| 53 | Brazil | 0.0078 | 0.0884 | 0.1388 | 0.0686 | 0.1558 |
| 54 | Moldova | 0.0357 | 0.0687 | 0.1359 | 0.0927 | 0.1226 |
| 55 | Philippines | 0.0044 | 0.0779 | 0.1371 | 0.1062 | 0.1265 |
| 56 | Bahrain | 0.0084 | 0.0878 | 0.166 | 0.047 | 0.1396 |
| 57 | Colombia | 0.0051 | 0.0775 | 0.1248 | 0.0954 | 0.1433 |
| 58 | Costa Rica | 0.0042 | 0.0721 | 0.1523 | 0.0954 | 0.1206 |
| 59 | India | 0.0266 | 0.071 | 0.1149 | 0.0822 | 0.1489 |
| 60 | N. Macedonia | 0.0095 | 0.0684 | 0.1409 | 0.0981 | 0.1237 |
| 61 | Kazakhstan | 0.0185 | 0.0639 | 0.1408 | 0.07 | 0.1473 |
| 62 | Mexico | 0.0111 | 0.0688 | 0.1291 | 0.0792 | 0.142 |
| 63 | Paraguay | 0.0091 | 0.0724 | 0.1424 | 0.0862 | 0.113 |
| 64 | Albania | 0.0087 | 0.0567 | 0.1313 | 0.09 | 0.1328 |
| 65 | Oman | 0.0053 | 0.065 | 0.1455 | 0.0473 | 0.1502 |
| 66 | South Africa | 0.0198 | 0.0689 | 0.1171 | 0.0778 | 0.1294 |
| 67 | Georgia | 0.0097 | 0.0577 | 0.1408 | 0.0941 | 0.1103 |
| 68 | Mauritius | 0.0149 | 0.0459 | 0.1311 | 0.09 | 0.1298 |
| 69 | Belarus | 0.0224 | 0.068 | 0.1396 | 0.0554 | 0.123 |
| 70 | Vietnam | 0.0145 | 0.0712 | 0.1396 | 0.0578 | 0.1241 |
| 71 | Morocco | 0.0068 | 0.0603 | 0.1247 | 0.113 | 0.1004 |
| 72 | Indonesia | 0.0064 | 0.0639 | 0.1382 | 0.0605 | 0.1342 |
| 73 | Peru | 0.0037 | 0.069 | 0.126 | 0.0819 | 0.1213 |
| 74 | Azerbaijan | 0.0093 | 0.0618 | 0.1361 | 0.0592 | 0.1253 |
| 75 | Montenegro | 0.0149 | 0.0566 | 0.1339 | 0.0765 | 0.1064 |
| 76 | Bangladesh | 0.024 | 0.0681 | 0.1204 | 0.0703 | 0.1021 |
| 77 | Tunisia | 0.011 | 0.0484 | 0.1225 | 0.0886 | 0.1142 |
| 78 | Kenya | 0.0047 | 0.0492 | 0.1391 | 0.0714 | 0.1193 |
| 79 | Dominican Republic | 0.0047 | 0.0597 | 0.1163 | 0.0754 | 0.1229 |
| 80 | Bosnia and Herzegovina | 0.0127 | 0.0634 | 0.1353 | 0.0697 | 0.0974 |
| 81 | Panama | 0.0032 | 0.0851 | 0.1279 | 0.05 | 0.1111 |
| 82 | Ecuador | 0.0045 | 0.0656 | 0.132 | 0.0365 | 0.1256 |
| 83 | Trinidad and Tobago | 0.0094 | 0.0622 | 0.1277 | 0.0551 | 0.1074 |
| 84 | Iran | 0.0149 | 0.0585 | 0.1482 | 0.0149 | 0.1113 |
| 85 | Egypt | 0.0064 | 0.0583 | 0.1098 | 0.0595 | 0.1135 |
| 86 | Nigeria | 0.0014 | 0.0552 | 0.1187 | 0.0768 | 0.0916 |
| 87 | Jordan | 0.0048 | 0.0754 | 0.1434 | 0.0297 | 0.0862 |
| 88 | Ghana | 0.0025 | 0.0531 | 0.0957 | 0.0724 | 0.1091 |
| 89 | Sri Lanka | 0.0071 | 0.0658 | 0.0943 | 0.0446 | 0.1184 |
| 90 | Mongolia | 0.015 | 0.059 | 0.135 | 0.0189 | 0.0951 |
| 91 | Kyrgyzstan | 0.0105 | 0.0603 | 0.0986 | 0.0457 | 0.1074 |
| 92 | Algeria | 0.005 | 0.0601 | 0.1312 | 0.0551 | 0.0707 |
| 93 | Bolivia | 0.0051 | 0.0583 | 0.1287 | 0.0324 | 0.0941 |
| 94 | Nepal | 0.0069 | 0.0684 | 0.1132 | 0.0497 | 0.0762 |
| 95 | Senegal | 0.0036 | 0.055 | 0.1048 | 0.0603 | 0.0906 |
| 96 | Pakistan | 0.006 | 0.0616 | 0.0938 | 0.0446 | 0.1015 |
| 97 | Jamaica | 0.0047 | 0.0584 | 0.113 | 0.0432 | 0.0859 |
| 98 | Uganda | 0.0007 | 0.0489 | 0.0777 | 0.0768 | 0.0943 |
| 99 | El Salvador | 0.0028 | 0.0662 | 0.1066 | 0.0257 | 0.0944 |
| 100 | Ivory Coast | 0.0006 | 0.0465 | 0.0881 | 0.0724 | 0.0869 |
| 101 | Cambodia | 0.0043 | 0.0631 | 0.1178 | 0.0162 | 0.0831 |
| 102 | Mali | 0.0011 | 0.0548 | 0.0969 | 0.0603 | 0.0689 |
| 103 | Namibia | 0.0046 | 0.0517 | 0.0955 | 0.0322 | 0.0899 |
| 104 | Guatemala | 0.0029 | 0.059 | 0.0877 | 0.0257 | 0.0878 |
| 105 | Zambia | 0.0034 | 0.0241 | 0.0935 | 0.0781 | 0.0613 |
| 106 | Botswana | 0.0051 | 0.0523 | 0.0977 | 0.023 | 0.0777 |
| 107 | Tanzania | 0.0021 | 0.0517 | 0.0813 | 0.0257 | 0.0924 |
| 108 | Honduras | 0.004 | 0.0675 | 0.0838 | 0.0108 | 0.0861 |
| 109 | Zimbabwe | 0.0019 | 0.034 | 0.0907 | 0.0362 | 0.0854 |
| 110 | Angola | 0.0047 | 0.0567 | 0.0576 | 0.0495 | 0.0748 |
| 111 | Laos | 0.0066 | 0.0489 | 0.0955 | 0.0189 | 0.059 |
| 112 | Tajikistan | 0.0108 | 0.0485 | 0.073 | 0.0108 | 0.0754 |
| 113 | Cameroon | 0.0014 | 0.0178 | 0.073 | 0.0338 | 0.0832 |
| 114 | Mozambique | 0.0021 | 0.0378 | 0.0526 | 0.0295 | 0.0815 |
| 115 | Ethiopia | 0.0032 | 0.0472 | 0.048 | 0.0338 | 0.0682 |
| 116 | Yemen | 0.007 | 0.0644 | 0.0479 | 0.0081 | 0.0527 |
| 117 | Congo DR | 0.0063 | 0.0596 | 0.0446 | 0.0027 | 0.0394 |
Overall, 15 of the top 20 highest-scoring countries were located in Europe, including #2 Denmark and #3 Germany, reflecting the region’s strong scores in electronic infrastructure and security.
In addition to Israel, the Asia region was represented at the top by #8 Japan, #10 South Korea, and #15 Singapore. The only non-Asian and non-European country to make the top 20 was the United States at #12.

GDP’s Impact on Digital Infrastructure
Of the 117 countries that had data available for the index, the majority of the lowest-ranking countries were in Africa or Asia. This includes the bottom five: Cameroon, Mozambique, Ethiopia, Yemen, and DR Congo.
In fact, when the DQL Index was charted against GDP per capita, a clear and unsurprising trend emerges:
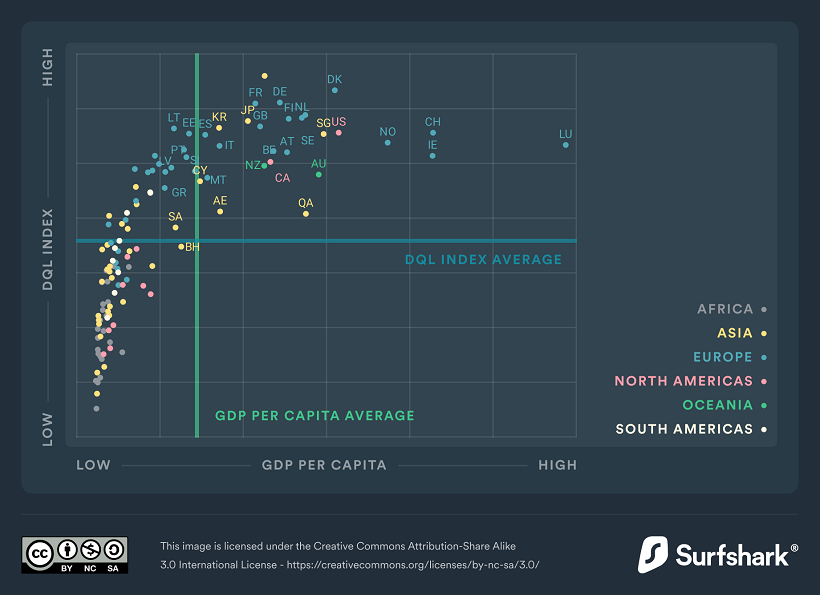
As countries have to grapple with limited resources and capital for increasing their digital wellbeing, we can see different priorities emerge. For example. many countries scored poorly on internet affordability and electronic government while prioritizing investments in internet quality and electronic infrastructure.
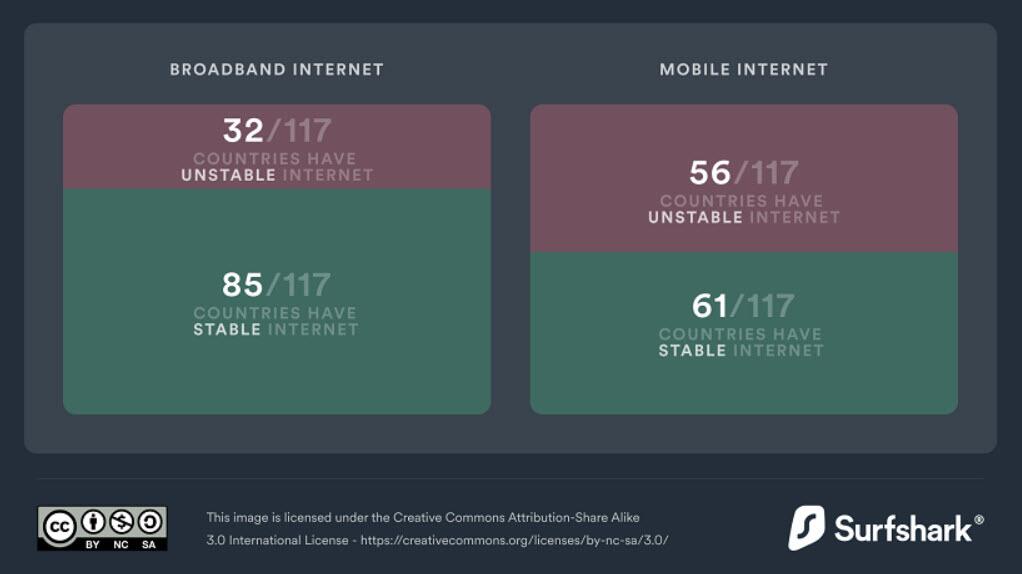
And despite the proliferation of mobile phones across the world, more countries were able to set up stable broadband internet over mobile internet.

To find out more interesting insights, dive in to the full Digital Quality of Life Index.
Life and work in the 21st century is increasingly reliant on modern technology, with a country’s digital quality of life playing a massive role on people’s day-to-day.
Some countries excel in internet access and affordability, while others have more modern digital systems and relevant laws. And, as Visual Capitalist’s Omri Wallach details below, many regions of the world suffer with lacking digital infrastructure and access across the board.
The 2022 Digital Quality of Life Index (DQL) from Surfshark analyzes countries on digital wellbeing, based on data from the UN, World Bank, Freedom House, and the International Communications Union.
5 Metrics for Measuring Digital Wellbeing
The DQL Index covers 117 countries with readily available data, making up 92% of the global population. Each country is scored on five pillars:
-
Internet Affordability—How much time people have to work to afford a stable internet connection.
-
Internet Quality—How fast and stable the internet connectivity in a country is and how well it’s improving.
-
Electronic Infrastructure—How well developed and inclusive a country’s existing electronic infrastructure is.
-
Electronic Security—How safe and protected people feel in a country.
-
Electronic Government—How advanced and digitized a country’s government services are.
Visualizing The World’s Digital Quality of Life
Overall, Europe and Asia led the digital quality of life rankings in 2022. Israel took the top spot with an incredibly strong score in internet affordability. Here are the countries sorted by rankings and their weighted scores in each category:
| Rank | Country | Affordability | Quality | E-infrastructure | E-security | E-government |
|---|---|---|---|---|---|---|
| 1 | Israel | 0.1917 | 0.0981 | 0.1668 | 0.1503 | 0.1541 |
| 2 | Denmark | 0.047 | 0.1186 | 0.1968 | 0.1878 | 0.1844 |
| 3 | Germany | 0.0718 | 0.0926 | 0.1922 | 0.1946 | 0.1612 |
| 4 | France | 0.0534 | 0.111 | 0.1834 | 0.1878 | 0.1749 |
| 5 | Sweden | 0.0213 | 0.1059 | 0.1958 | 0.1878 | 0.1787 |
| 6 | Netherlands | 0.0241 | 0.0985 | 0.1956 | 0.1865 | 0.1796 |
| 7 | Finland | 0.0171 | 0.0973 | 0.192 | 0.1892 | 0.1869 |
| 8 | Japan | 0.0684 | 0.1024 | 0.1846 | 0.1462 | 0.177 |
| 9 | U.K. | 0.0413 | 0.0898 | 0.1882 | 0.1611 | 0.188 |
| 10 | South Korea | 0.0252 | 0.1139 | 0.1884 | 0.1516 | 0.1868 |
| 11 | Lithuania | 0.0508 | 0.087 | 0.1705 | 0.1973 | 0.1592 |
| 12 | U.S. | 0.0326 | 0.113 | 0.1944 | 0.1224 | 0.1947 |
| 13 | Switzerland | 0.0337 | 0.1114 | 0.1914 | 0.1597 | 0.1607 |
| 14 | Estonia | 0.0219 | 0.0759 | 0.1852 | 0.1946 | 0.1779 |
| 15 | Singapore | 0.0717 | 0.1134 | 0.1852 | 0.0943 | 0.19 |
| 16 | Spain | 0.0257 | 0.0924 | 0.1777 | 0.1919 | 0.1656 |
| 17 | Norway | 0.0136 | 0.0923 | 0.194 | 0.1649 | 0.174 |
| 18 | Luxembourg | 0.0272 | 0.0911 | 0.1878 | 0.1689 | 0.1597 |
| 19 | Italy | 0.0362 | 0.082 | 0.1733 | 0.1824 | 0.159 |
| 20 | Portugal | 0.0085 | 0.1101 | 0.1576 | 0.1932 | 0.1565 |
| 21 | Belgium | 0.0162 | 0.0868 | 0.1823 | 0.1973 | 0.1409 |
| 22 | Austria | 0.0279 | 0.0717 | 0.1782 | 0.1716 | 0.1719 |
| 23 | Poland | 0.0242 | 0.0869 | 0.1566 | 0.1905 | 0.1568 |
| 24 | Ireland | 0.0217 | 0.0874 | 0.1799 | 0.1662 | 0.1596 |
| 25 | Czechia | 0.023 | 0.0755 | 0.1707 | 0.196 | 0.1472 |
| 26 | Canada | 0.0228 | 0.0967 | 0.1831 | 0.1289 | 0.1723 |
| 27 | Hungary | 0.0206 | 0.1046 | 0.1647 | 0.1676 | 0.1425 |
| 28 | New Zealand | 0.0166 | 0.1027 | 0.1731 | 0.1341 | 0.1702 |
| 29 | Slovakia | 0.0233 | 0.0807 | 0.161 | 0.1865 | 0.1417 |
| 30 | Bulgaria | 0.0308 | 0.1025 | 0.1352 | 0.177 | 0.1452 |
| 31 | Croatia | 0.0133 | 0.0911 | 0.1625 | 0.1865 | 0.1346 |
| 32 | Slovenia | 0.0102 | 0.0934 | 0.1619 | 0.1622 | 0.1591 |
| 33 | Latvia | 0.0235 | 0.0918 | 0.1628 | 0.1784 | 0.1289 |
| 34 | Romania | 0.0299 | 0.105 | 0.1427 | 0.1743 | 0.1327 |
| 35 | Australia | 0.0453 | 0.0706 | 0.1755 | 0.1089 | 0.1802 |
| 36 | Malta | 0.0104 | 0.093 | 0.1639 | 0.1527 | 0.1547 |
| 37 | Cyprus | 0.0139 | 0.0718 | 0.1589 | 0.1689 | 0.1548 |
| 38 | Malaysia | 0.0319 | 0.0838 | 0.1636 | 0.1224 | 0.1561 |
| 39 | Greece | 0.0085 | 0.0713 | 0.142 | 0.2 | 0.1344 |
| 40 | Chile | 0.0251 | 0.1202 | 0.1469 | 0.1022 | 0.1538 |
| 41 | Uruguay | 0.0051 | 0.1054 | 0.1569 | 0.13 | 0.1498 |
| 42 | Russia | 0.0556 | 0.0794 | 0.1512 | 0.0943 | 0.152 |
| 43 | China | 0.0241 | 0.1045 | 0.1485 | 0.0741 | 0.175 |
| 44 | U.A.E. | 0.0071 | 0.1148 | 0.1779 | 0.0419 | 0.1712 |
| 45 | Argentina | 0.0073 | 0.0694 | 0.1575 | 0.13 | 0.1464 |
| 46 | Qatar | 0.0077 | 0.1077 | 0.1705 | 0.0808 | 0.1421 |
| 47 | Armenia | 0.1009 | 0.07 | 0.1356 | 0.0765 | 0.1221 |
| 48 | Serbia | 0.0184 | 0.0739 | 0.1387 | 0.1238 | 0.1429 |
| 49 | Thailand | 0.0081 | 0.1045 | 0.151 | 0.0876 | 0.1391 |
| 50 | Ukraine | 0.0259 | 0.0581 | 0.1613 | 0.1184 | 0.1256 |
| 51 | Saudi Arabia | 0.0057 | 0.0873 | 0.1635 | 0.0865 | 0.1408 |
| 52 | Turkey | 0.0153 | 0.0679 | 0.1526 | 0.0968 | 0.1488 |
| 53 | Brazil | 0.0078 | 0.0884 | 0.1388 | 0.0686 | 0.1558 |
| 54 | Moldova | 0.0357 | 0.0687 | 0.1359 | 0.0927 | 0.1226 |
| 55 | Philippines | 0.0044 | 0.0779 | 0.1371 | 0.1062 | 0.1265 |
| 56 | Bahrain | 0.0084 | 0.0878 | 0.166 | 0.047 | 0.1396 |
| 57 | Colombia | 0.0051 | 0.0775 | 0.1248 | 0.0954 | 0.1433 |
| 58 | Costa Rica | 0.0042 | 0.0721 | 0.1523 | 0.0954 | 0.1206 |
| 59 | India | 0.0266 | 0.071 | 0.1149 | 0.0822 | 0.1489 |
| 60 | N. Macedonia | 0.0095 | 0.0684 | 0.1409 | 0.0981 | 0.1237 |
| 61 | Kazakhstan | 0.0185 | 0.0639 | 0.1408 | 0.07 | 0.1473 |
| 62 | Mexico | 0.0111 | 0.0688 | 0.1291 | 0.0792 | 0.142 |
| 63 | Paraguay | 0.0091 | 0.0724 | 0.1424 | 0.0862 | 0.113 |
| 64 | Albania | 0.0087 | 0.0567 | 0.1313 | 0.09 | 0.1328 |
| 65 | Oman | 0.0053 | 0.065 | 0.1455 | 0.0473 | 0.1502 |
| 66 | South Africa | 0.0198 | 0.0689 | 0.1171 | 0.0778 | 0.1294 |
| 67 | Georgia | 0.0097 | 0.0577 | 0.1408 | 0.0941 | 0.1103 |
| 68 | Mauritius | 0.0149 | 0.0459 | 0.1311 | 0.09 | 0.1298 |
| 69 | Belarus | 0.0224 | 0.068 | 0.1396 | 0.0554 | 0.123 |
| 70 | Vietnam | 0.0145 | 0.0712 | 0.1396 | 0.0578 | 0.1241 |
| 71 | Morocco | 0.0068 | 0.0603 | 0.1247 | 0.113 | 0.1004 |
| 72 | Indonesia | 0.0064 | 0.0639 | 0.1382 | 0.0605 | 0.1342 |
| 73 | Peru | 0.0037 | 0.069 | 0.126 | 0.0819 | 0.1213 |
| 74 | Azerbaijan | 0.0093 | 0.0618 | 0.1361 | 0.0592 | 0.1253 |
| 75 | Montenegro | 0.0149 | 0.0566 | 0.1339 | 0.0765 | 0.1064 |
| 76 | Bangladesh | 0.024 | 0.0681 | 0.1204 | 0.0703 | 0.1021 |
| 77 | Tunisia | 0.011 | 0.0484 | 0.1225 | 0.0886 | 0.1142 |
| 78 | Kenya | 0.0047 | 0.0492 | 0.1391 | 0.0714 | 0.1193 |
| 79 | Dominican Republic | 0.0047 | 0.0597 | 0.1163 | 0.0754 | 0.1229 |
| 80 | Bosnia and Herzegovina | 0.0127 | 0.0634 | 0.1353 | 0.0697 | 0.0974 |
| 81 | Panama | 0.0032 | 0.0851 | 0.1279 | 0.05 | 0.1111 |
| 82 | Ecuador | 0.0045 | 0.0656 | 0.132 | 0.0365 | 0.1256 |
| 83 | Trinidad and Tobago | 0.0094 | 0.0622 | 0.1277 | 0.0551 | 0.1074 |
| 84 | Iran | 0.0149 | 0.0585 | 0.1482 | 0.0149 | 0.1113 |
| 85 | Egypt | 0.0064 | 0.0583 | 0.1098 | 0.0595 | 0.1135 |
| 86 | Nigeria | 0.0014 | 0.0552 | 0.1187 | 0.0768 | 0.0916 |
| 87 | Jordan | 0.0048 | 0.0754 | 0.1434 | 0.0297 | 0.0862 |
| 88 | Ghana | 0.0025 | 0.0531 | 0.0957 | 0.0724 | 0.1091 |
| 89 | Sri Lanka | 0.0071 | 0.0658 | 0.0943 | 0.0446 | 0.1184 |
| 90 | Mongolia | 0.015 | 0.059 | 0.135 | 0.0189 | 0.0951 |
| 91 | Kyrgyzstan | 0.0105 | 0.0603 | 0.0986 | 0.0457 | 0.1074 |
| 92 | Algeria | 0.005 | 0.0601 | 0.1312 | 0.0551 | 0.0707 |
| 93 | Bolivia | 0.0051 | 0.0583 | 0.1287 | 0.0324 | 0.0941 |
| 94 | Nepal | 0.0069 | 0.0684 | 0.1132 | 0.0497 | 0.0762 |
| 95 | Senegal | 0.0036 | 0.055 | 0.1048 | 0.0603 | 0.0906 |
| 96 | Pakistan | 0.006 | 0.0616 | 0.0938 | 0.0446 | 0.1015 |
| 97 | Jamaica | 0.0047 | 0.0584 | 0.113 | 0.0432 | 0.0859 |
| 98 | Uganda | 0.0007 | 0.0489 | 0.0777 | 0.0768 | 0.0943 |
| 99 | El Salvador | 0.0028 | 0.0662 | 0.1066 | 0.0257 | 0.0944 |
| 100 | Ivory Coast | 0.0006 | 0.0465 | 0.0881 | 0.0724 | 0.0869 |
| 101 | Cambodia | 0.0043 | 0.0631 | 0.1178 | 0.0162 | 0.0831 |
| 102 | Mali | 0.0011 | 0.0548 | 0.0969 | 0.0603 | 0.0689 |
| 103 | Namibia | 0.0046 | 0.0517 | 0.0955 | 0.0322 | 0.0899 |
| 104 | Guatemala | 0.0029 | 0.059 | 0.0877 | 0.0257 | 0.0878 |
| 105 | Zambia | 0.0034 | 0.0241 | 0.0935 | 0.0781 | 0.0613 |
| 106 | Botswana | 0.0051 | 0.0523 | 0.0977 | 0.023 | 0.0777 |
| 107 | Tanzania | 0.0021 | 0.0517 | 0.0813 | 0.0257 | 0.0924 |
| 108 | Honduras | 0.004 | 0.0675 | 0.0838 | 0.0108 | 0.0861 |
| 109 | Zimbabwe | 0.0019 | 0.034 | 0.0907 | 0.0362 | 0.0854 |
| 110 | Angola | 0.0047 | 0.0567 | 0.0576 | 0.0495 | 0.0748 |
| 111 | Laos | 0.0066 | 0.0489 | 0.0955 | 0.0189 | 0.059 |
| 112 | Tajikistan | 0.0108 | 0.0485 | 0.073 | 0.0108 | 0.0754 |
| 113 | Cameroon | 0.0014 | 0.0178 | 0.073 | 0.0338 | 0.0832 |
| 114 | Mozambique | 0.0021 | 0.0378 | 0.0526 | 0.0295 | 0.0815 |
| 115 | Ethiopia | 0.0032 | 0.0472 | 0.048 | 0.0338 | 0.0682 |
| 116 | Yemen | 0.007 | 0.0644 | 0.0479 | 0.0081 | 0.0527 |
| 117 | Congo DR | 0.0063 | 0.0596 | 0.0446 | 0.0027 | 0.0394 |
Overall, 15 of the top 20 highest-scoring countries were located in Europe, including #2 Denmark and #3 Germany, reflecting the region’s strong scores in electronic infrastructure and security.
In addition to Israel, the Asia region was represented at the top by #8 Japan, #10 South Korea, and #15 Singapore. The only non-Asian and non-European country to make the top 20 was the United States at #12.
GDP’s Impact on Digital Infrastructure
Of the 117 countries that had data available for the index, the majority of the lowest-ranking countries were in Africa or Asia. This includes the bottom five: Cameroon, Mozambique, Ethiopia, Yemen, and DR Congo.
In fact, when the DQL Index was charted against GDP per capita, a clear and unsurprising trend emerges:

As countries have to grapple with limited resources and capital for increasing their digital wellbeing, we can see different priorities emerge. For example. many countries scored poorly on internet affordability and electronic government while prioritizing investments in internet quality and electronic infrastructure.
And despite the proliferation of mobile phones across the world, more countries were able to set up stable broadband internet over mobile internet.
To find out more interesting insights, dive in to the full Digital Quality of Life Index.
Loading…