Now that the September payrolls report is in the history books, Deutsche Bank FX strategist Alan Ruskin published a good piece reminding readers that the labor market usually remains resilient for many quarters after the Fed starts hiking. i.e., it lags... by a lot.
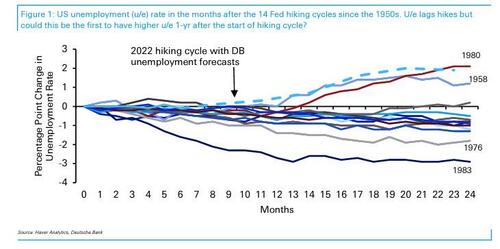
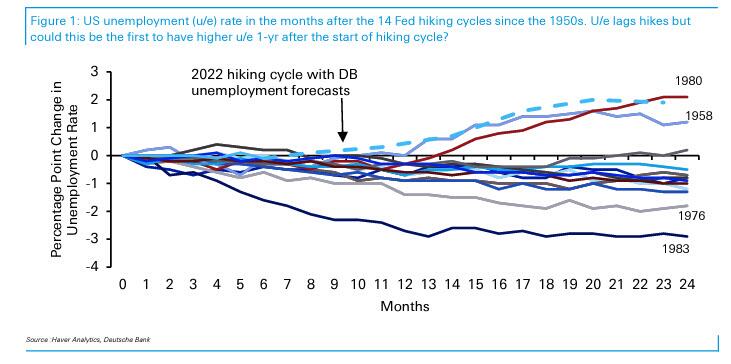
That data encouraged DB's Jim Reid to dust off an old graph looking at how the unemployment rate has progressed over the last 13 Fed hiking cycles back to the mid-1950s. Interestingly, the chart finds that 12 months on from the first hike, all previous cycles saw the unemployment rate either flat (1958-) or lower (all 12 others).
So with Friday's print at 3.5% we’re now a tenth lower 6 months on from the first hike, but if the bank's forecasts come true, this could still be the first time unemployment is higher one year on across the 70 years of data covered in the chart.
To Reid, this suggests a couple of things
- The labor market always lags.
- The Fed started hiking far too late in this cycle. The 3.6% rate at the start was the lowest of the now 14 hiking cycles (including this one) with the next lowest the 4.1% in 1999. The average is 5.9%. Not only was 3.6% very low but all evidence pointed to NAIRU having gone up notably versus recent cycles post pandemic.
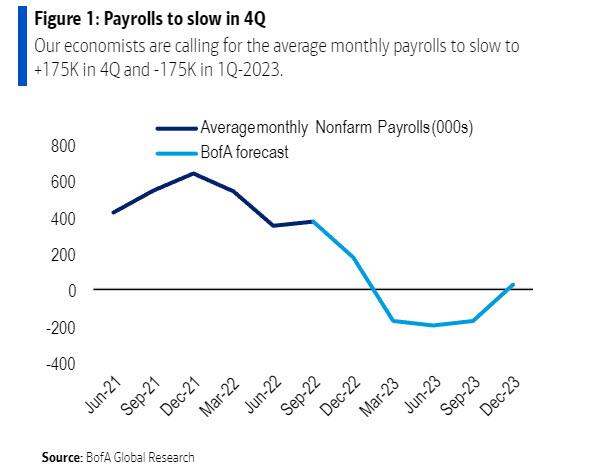
Overall, Reid concludes, it wouldn’t be a surprise to see a few more months of strong labor markets but this cycle is likely much more advanced than all the previous ones in the graph at the same stage. This confirms the Bank of America forecast that as job growth is expected to shrink sharply in Q4, in Q1 the average monthly payrolls will turn a negative 175K as the US recession unfolds.
Another example of this is that the 2s10s curve normally inverts a couple of years after the Fed hikes. In this cycle it only took a few days, by far the shortest gap in history.
Now that the September payrolls report is in the history books, Deutsche Bank FX strategist Alan Ruskin published a good piece reminding readers that the labor market usually remains resilient for many quarters after the Fed starts hiking. i.e., it lags… by a lot.
That data encouraged DB’s Jim Reid to dust off an old graph looking at how the unemployment rate has progressed over the last 13 Fed hiking cycles back to the mid-1950s. Interestingly, the chart finds that 12 months on from the first hike, all previous cycles saw the unemployment rate either flat (1958-) or lower (all 12 others).
So with Friday’s print at 3.5% we’re now a tenth lower 6 months on from the first hike, but if the bank’s forecasts come true, this could still be the first time unemployment is higher one year on across the 70 years of data covered in the chart.

To Reid, this suggests a couple of things
- The labor market always lags.
- The Fed started hiking far too late in this cycle. The 3.6% rate at the start was the lowest of the now 14 hiking cycles (including this one) with the next lowest the 4.1% in 1999. The average is 5.9%. Not only was 3.6% very low but all evidence pointed to NAIRU having gone up notably versus recent cycles post pandemic.
Overall, Reid concludes, it wouldn’t be a surprise to see a few more months of strong labor markets but this cycle is likely much more advanced than all the previous ones in the graph at the same stage. This confirms the Bank of America forecast that as job growth is expected to shrink sharply in Q4, in Q1 the average monthly payrolls will turn a negative 175K as the US recession unfolds.

Another example of this is that the 2s10s curve normally inverts a couple of years after the Fed hikes. In this cycle it only took a few days, by far the shortest gap in history.