Authored by Mike Shedlock via MishTalk.com,
Federal tax receipts suggest GDI numbers, not GDP numbers, are accurate. They also hint at recession...

Tax receipts from the BEA, chart by Mish
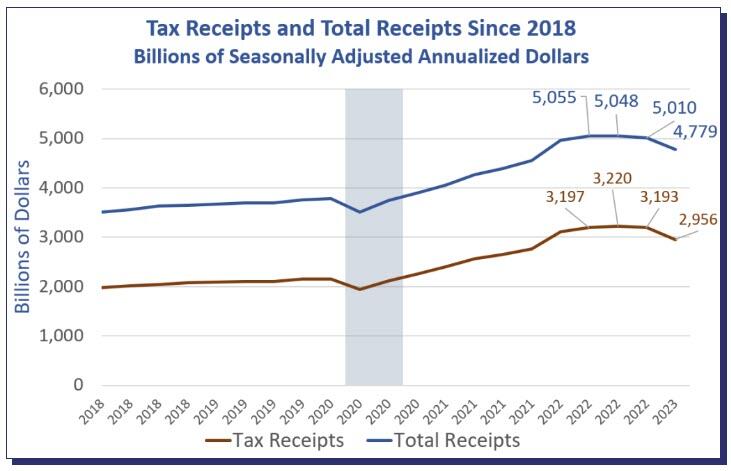
Tax receipts and total receipts are from the Bureau of Economic Analysis which also produces the government GDP estimates.
Data is through 2023 Q1 because tax data, like Gross Domestic Income (GDI) is not available in the first estimate of GDP for the quarter.
Tax Receipts and Total Receipts Since 2018
Tax receipts from the BEA, chart by Mish
Total receipts have fallen three consecutive quarters. Tax receipts have fallen two straight quarters.
Total Receipts and Tax Receipts Percent Change From Previous Quarter
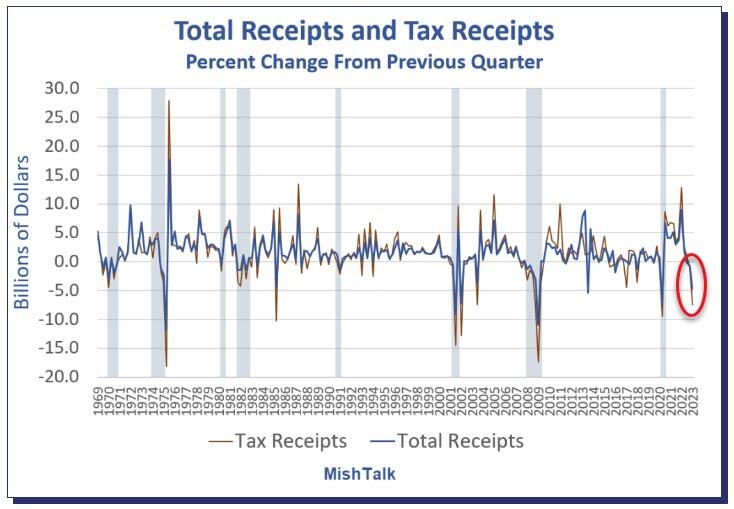
Tax receipts from the BEA, percent change calculation and chart by Mish
When tax receipts and total receipts both plunge, the economy is typically in recession. There were false signals in 1985 and 2003. There have also been recessions unconfirmed by plunging receipts so this is admittedly not the greatest of signals. But the tax data and the income data align,
Real GDP Beats Expectations, Rises 2.4 Percent in First Estimate for 2023 Q2
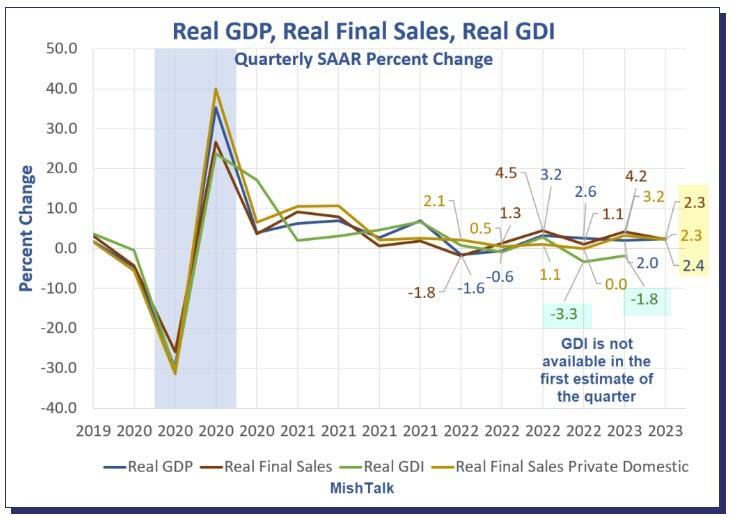
On July 27, I noted Real GDP Beats Expectations, Rises 2.4 Percent in First Estimate for 2023 Q2
Nearly everyone cheered the strong report, except it was not entirely strong. GDI did not confirm GDP. GDI was negative for two consecutive quarters.
Nonfarm Payrolls and Employment Levels

Nonfarm payrolls and employment levels from the BLS, chart by Mish.
Payrolls vs Employment Since May 2022
-
Nonfarm Payrolls: +4,162,000
-
Employment Level: +2,695,000
-
Full Time Employment: +2,116,000
Of the 894,000 rise in employment in January, 810,000 was due to annual benchmark revisions. And the BLS does not say what months were revised, just poof, here you go. Again, we cannot, with strong confidence, suggest these reports portray an accurate picture of either jobs or employment.
Every month, economists and the mainstream media tout strong jobs reports. But the household survey (employment levels) have not matched nonfarm payrolls (the establishment survey).
They measure two things. The establishment survey is a count of jobs, whereas in the household survey you are either employed or not regardless of how many jobs you have.
The discrepancy between jobs and employment also lends credence to GDI not GDP. So does the index of total hours worked.
The BLS Jobs Report Falls Way Short of Stellar ADP Expectation
I discuss these discrepancies every month when the job surveys are published. For the latest report, please see The BLS Jobs Report Falls Way Short of Stellar ADP Expectation
The payroll tax data, income data, and the household survey are all in sync. GDP is the odd man out.
* * *
Authored by Mike Shedlock via MishTalk.com,
Federal tax receipts suggest GDI numbers, not GDP numbers, are accurate. They also hint at recession…

Tax receipts from the BEA, chart by Mish
Tax receipts and total receipts are from the Bureau of Economic Analysis which also produces the government GDP estimates.
Data is through 2023 Q1 because tax data, like Gross Domestic Income (GDI) is not available in the first estimate of GDP for the quarter.
Tax Receipts and Total Receipts Since 2018

Tax receipts from the BEA, chart by Mish
Total receipts have fallen three consecutive quarters. Tax receipts have fallen two straight quarters.
Total Receipts and Tax Receipts Percent Change From Previous Quarter

Tax receipts from the BEA, percent change calculation and chart by Mish
When tax receipts and total receipts both plunge, the economy is typically in recession. There were false signals in 1985 and 2003. There have also been recessions unconfirmed by plunging receipts so this is admittedly not the greatest of signals. But the tax data and the income data align,
Real GDP Beats Expectations, Rises 2.4 Percent in First Estimate for 2023 Q2

On July 27, I noted Real GDP Beats Expectations, Rises 2.4 Percent in First Estimate for 2023 Q2
Nearly everyone cheered the strong report, except it was not entirely strong. GDI did not confirm GDP. GDI was negative for two consecutive quarters.
Nonfarm Payrolls and Employment Levels

Nonfarm payrolls and employment levels from the BLS, chart by Mish.
Payrolls vs Employment Since May 2022
-
Nonfarm Payrolls: +4,162,000
-
Employment Level: +2,695,000
-
Full Time Employment: +2,116,000
Of the 894,000 rise in employment in January, 810,000 was due to annual benchmark revisions. And the BLS does not say what months were revised, just poof, here you go. Again, we cannot, with strong confidence, suggest these reports portray an accurate picture of either jobs or employment.
Every month, economists and the mainstream media tout strong jobs reports. But the household survey (employment levels) have not matched nonfarm payrolls (the establishment survey).
They measure two things. The establishment survey is a count of jobs, whereas in the household survey you are either employed or not regardless of how many jobs you have.
The discrepancy between jobs and employment also lends credence to GDI not GDP. So does the index of total hours worked.
The BLS Jobs Report Falls Way Short of Stellar ADP Expectation
I discuss these discrepancies every month when the job surveys are published. For the latest report, please see The BLS Jobs Report Falls Way Short of Stellar ADP Expectation
The payroll tax data, income data, and the household survey are all in sync. GDP is the odd man out.
* * *
Loading…