
Where do you fall on the distribution of income in the United States?

The nice people over at Political Calculations blog can help you answer this question using the data that the U.S. Census Bureau has collected on the total money income earned by individual Americans as well as for the families and households into which Americans gather themselves!
If you're a visual person, we'll first present the U.S. income distribution information in three charts presenting the cumulative distribution of income for U.S. individuals, U.S. households, and U.S. families.
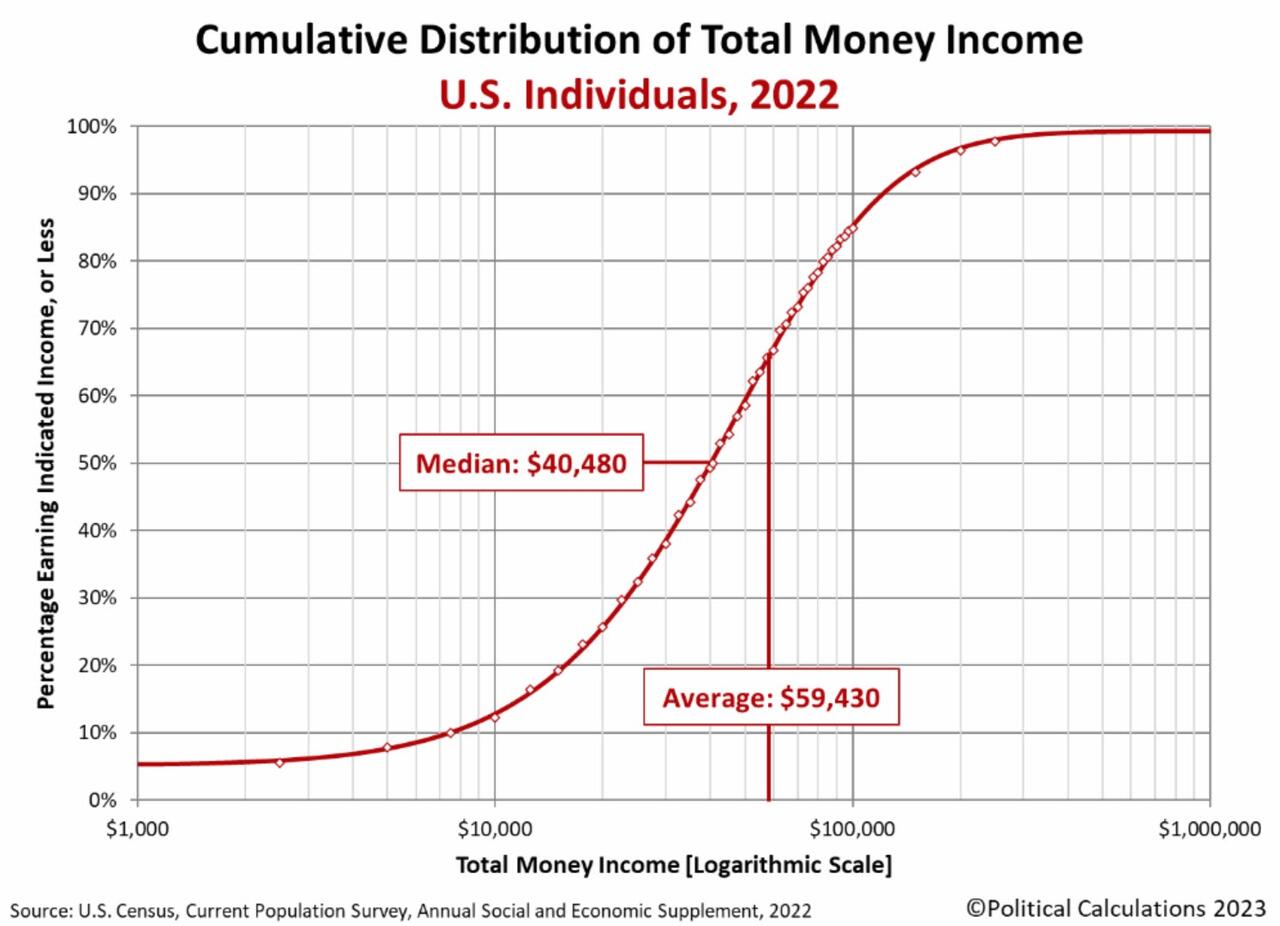
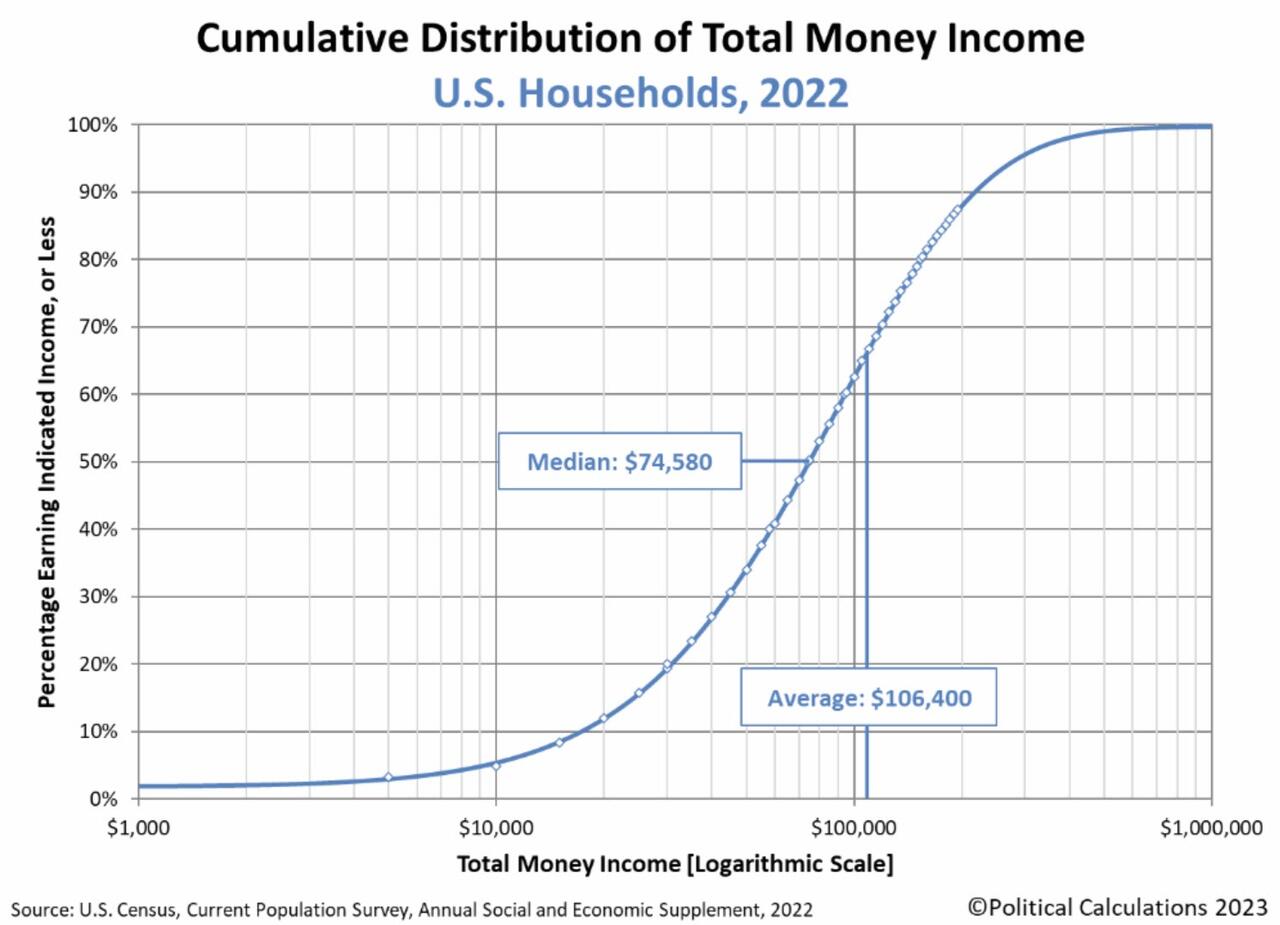
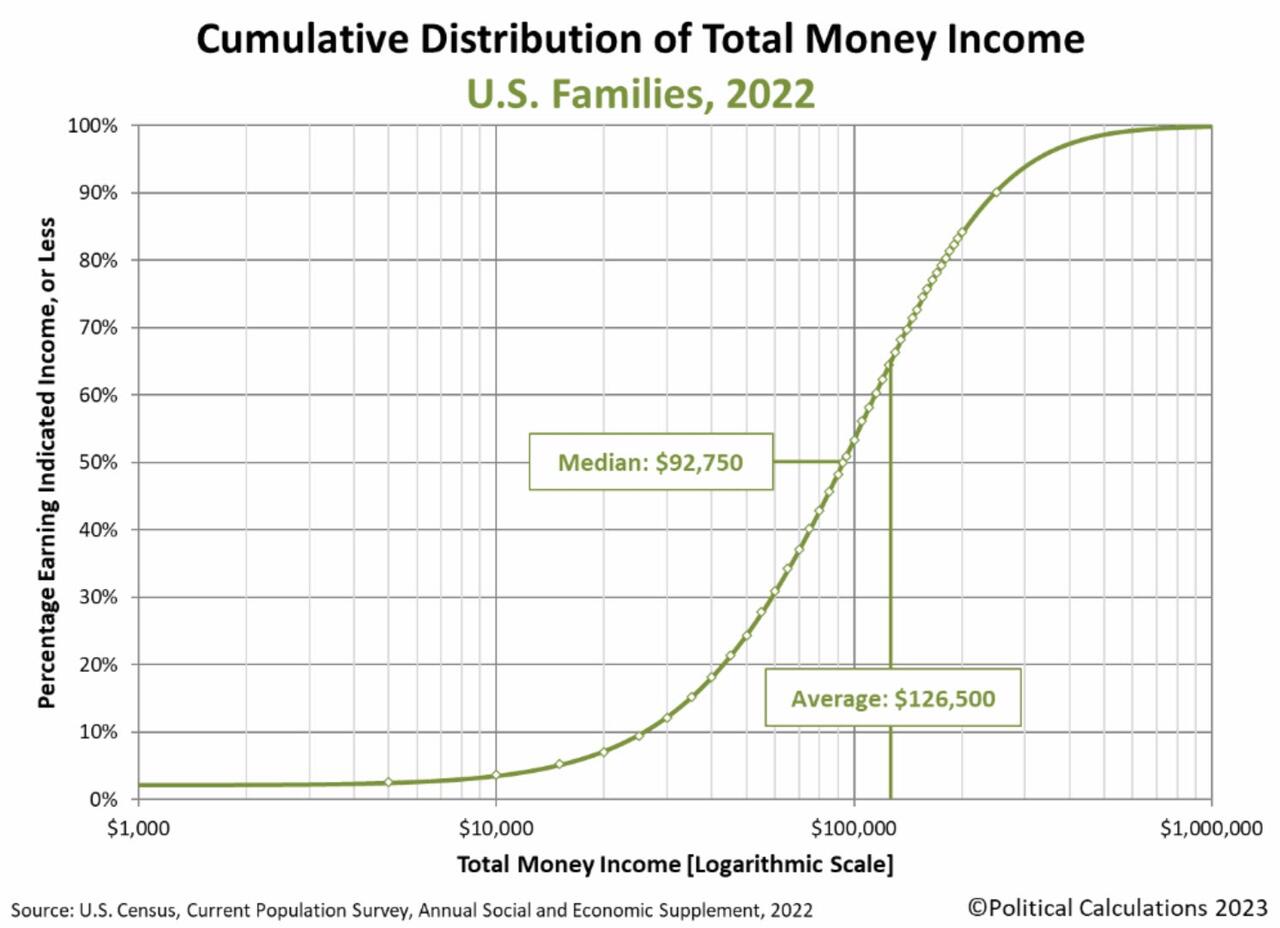
To use these charts, first find the income that applies for you on the horizontal axis, then move directly upward to the curve that defines the cumulative distribution of income. Once you've found your place on S-shaped curve in each chart, look directly to the vertical scale on the left hand side of the chart to determine your approximate U.S. income percentile ranking. Each of the charts will be displayed for five seconds and will cycle back to the beginning after running through each of the charts. The charts will also indicate the median and average income earned by each category.
Now, let's find out more precisely where you really fit into the 2022 distribution of income! To find out where you, your family or your household ranks among each of these categories, just enter your personal income, your family's income, which includes the incomes of your spouse and other family members who live with you, and also the combined income of just the people who live within the walls of the same household that you do, into the following tool. We'll do some quick math and provide a more better estimate of the percentage of all American individuals, families and households that you outrank given the incomes you enter than you can get from scanning the charts. We'll also break down the numbers for your Individual income to tell you how you compare to your fellow male and female Americans.
Click on the calculator image below to access a working version of our tool.
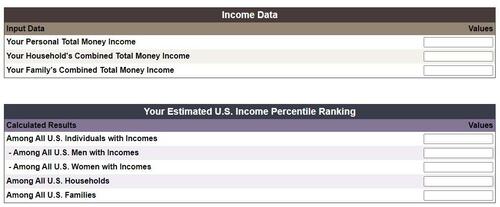
Our tool should be able to place most people within half a percentile of their actual income percentile. A percentile of zero indicates that you are at the very bottom end of the U.S. income spectrum, while a percentile ranking of 100 indicates that you are effectively at the very top end. A percentile rank of 50.0 puts you at the median, where 50% of the U.S. population would have a higher income and 50% has a lower income.
For our readers who live outside of the United States, you can still get in on the action if you convert your income from your local currency into U.S. dollars first!
If you want a more precise estimate of your income percentile ranking within the U.S., please check out Don't Quit Your Day Job's Income Percentile Calculator. DQYDJ uses a more refined version of the U.S. Census Bureau's income data to estimate the distribution of total money income within the United States, which means that compared to our tool, which will put you in the right seating section of the ballpark, PK's tool can put you in the right row of that seating section.
Finally, if you're looking for the income data for 2023, please note that the U.S. Census Bureau will report the data it collects for this year sometime in September 2024. The data for 2023 won't even be collected until March 2024, when Americans will be preparing their income tax returns for the 2023 tax year and have all the records needed to do that. The Census Bureau's statisticians will then take the next six months to analyze all the income data they collect before reporting their results.
Where do you fall on the distribution of income in the United States?

The nice people over at Political Calculations blog can help you answer this question using the data that the U.S. Census Bureau has collected on the total money income earned by individual Americans as well as for the families and households into which Americans gather themselves!
If you’re a visual person, we’ll first present the U.S. income distribution information in three charts presenting the cumulative distribution of income for U.S. individuals, U.S. households, and U.S. families.


To use these charts, first find the income that applies for you on the horizontal axis, then move directly upward to the curve that defines the cumulative distribution of income. Once you’ve found your place on S-shaped curve in each chart, look directly to the vertical scale on the left hand side of the chart to determine your approximate U.S. income percentile ranking. Each of the charts will be displayed for five seconds and will cycle back to the beginning after running through each of the charts. The charts will also indicate the median and average income earned by each category.
Now, let’s find out more precisely where you really fit into the 2022 distribution of income! To find out where you, your family or your household ranks among each of these categories, just enter your personal income, your family’s income, which includes the incomes of your spouse and other family members who live with you, and also the combined income of just the people who live within the walls of the same household that you do, into the following tool. We’ll do some quick math and provide a more better estimate of the percentage of all American individuals, families and households that you outrank given the incomes you enter than you can get from scanning the charts. We’ll also break down the numbers for your Individual income to tell you how you compare to your fellow male and female Americans.
Click on the calculator image below to access a working version of our tool.
Our tool should be able to place most people within half a percentile of their actual income percentile. A percentile of zero indicates that you are at the very bottom end of the U.S. income spectrum, while a percentile ranking of 100 indicates that you are effectively at the very top end. A percentile rank of 50.0 puts you at the median, where 50% of the U.S. population would have a higher income and 50% has a lower income.
For our readers who live outside of the United States, you can still get in on the action if you convert your income from your local currency into U.S. dollars first!
If you want a more precise estimate of your income percentile ranking within the U.S., please check out Don’t Quit Your Day Job’s Income Percentile Calculator. DQYDJ uses a more refined version of the U.S. Census Bureau’s income data to estimate the distribution of total money income within the United States, which means that compared to our tool, which will put you in the right seating section of the ballpark, PK’s tool can put you in the right row of that seating section.
Finally, if you’re looking for the income data for 2023, please note that the U.S. Census Bureau will report the data it collects for this year sometime in September 2024. The data for 2023 won’t even be collected until March 2024, when Americans will be preparing their income tax returns for the 2023 tax year and have all the records needed to do that. The Census Bureau’s statisticians will then take the next six months to analyze all the income data they collect before reporting their results.
Loading…


