Two weeks ago we calculated that based on the recent collapse in stock prices, US households have lost at least $20 trillion in net worth simply because financial assets (unlike tangible assets such as real estate) represent the vast majority of the US household balance sheet (at least that of the top 10%; the bottom 50% have virtually no assets but lots of liabilities, i.e., debt).
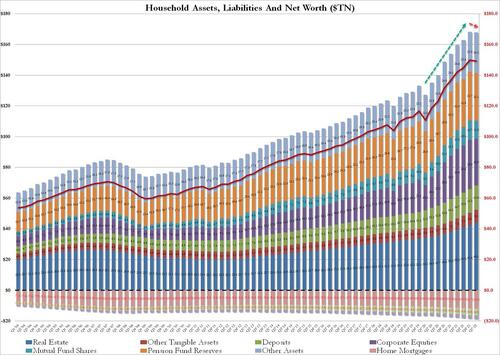
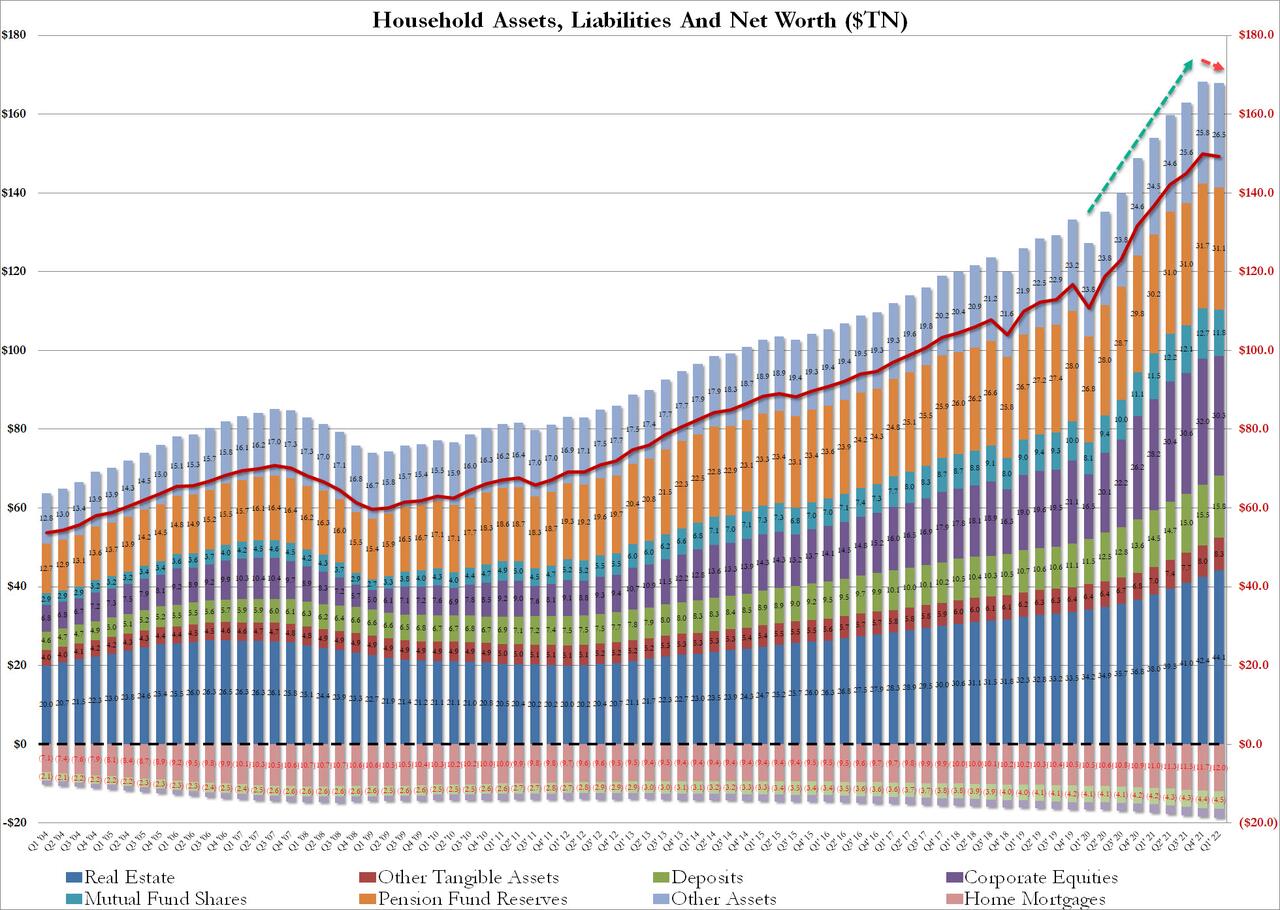
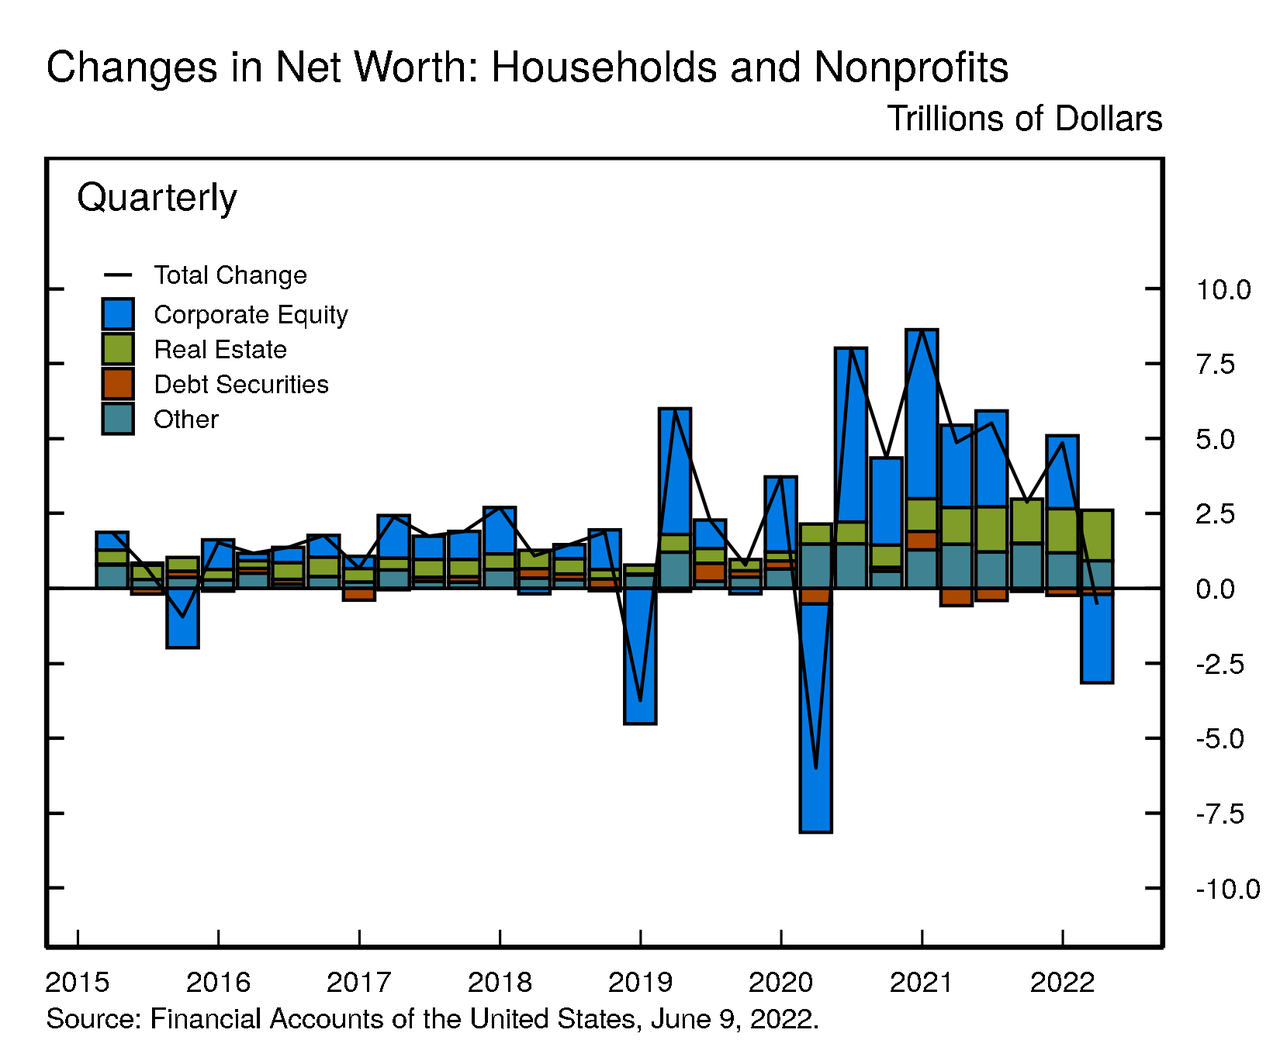
Today, the Fed released its quarterly Financial Accounts (also known as Flow of Funds or Z.1) statement which, among other things, gives the official estimation of household net worth for the US (along with fund flows and stock levels for all aspects of the US economy). The only problem is that as of March 31, said "calculation" was laughable, with the Fed - which clearly has gotten its pig lipsticking marching orders from the Biden admin - reporting that in the first quarter, in which stocks basically crashed into a bear market, wiping out tens of trillions in market cap, household net worth decreased by only $0.5 trillion in the first quarter, fueled by a $3 trillion drop in stock values (and offset by a $1.7 trillion increase in real estate, the same increase which the Fed is scrambling to destroy by sending mortgage rates into orbit), or visually:

This is laughable because as we noted at the end of May, just the net worth of the world’s 500 richest people had by dropped $1.6 trillion since its peak in November, as calculated by Bloomberg, with US Billionaires losing $800 billion, or more than the entire US supposedly lost in net worth in the entire first quarter.
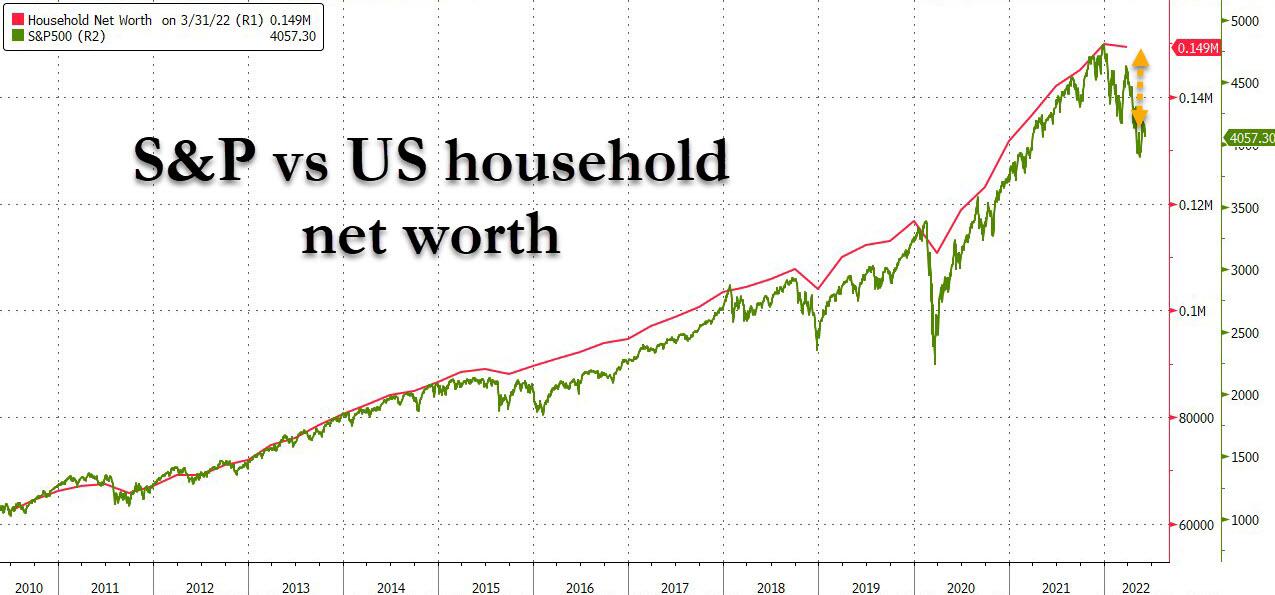
Why would the Fed embellish yet another number? Perhaps because the Biden admin, already pounded daily on all sides by attacks its senile incompetence has sparked the worst stagflationary economic crash in 40 years, did not want to also be accused of wiping out tens of trillions in net worth. Well, the Fed may have kicked the can, but it won't be able to do it for much longer: as the next chart shows, unless stocks make some remarkable recovery in the next 3 weeks, the Q2 net worth crash will be the biggest ever, and this time not even the Fed can do anything to make it less painful.

Laughable of not, let's dig into the the numbers, if only for the sake of continuity, straight from he Fed:
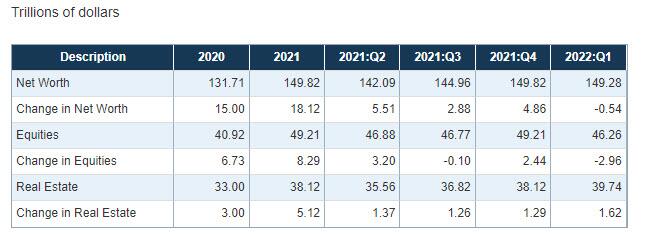
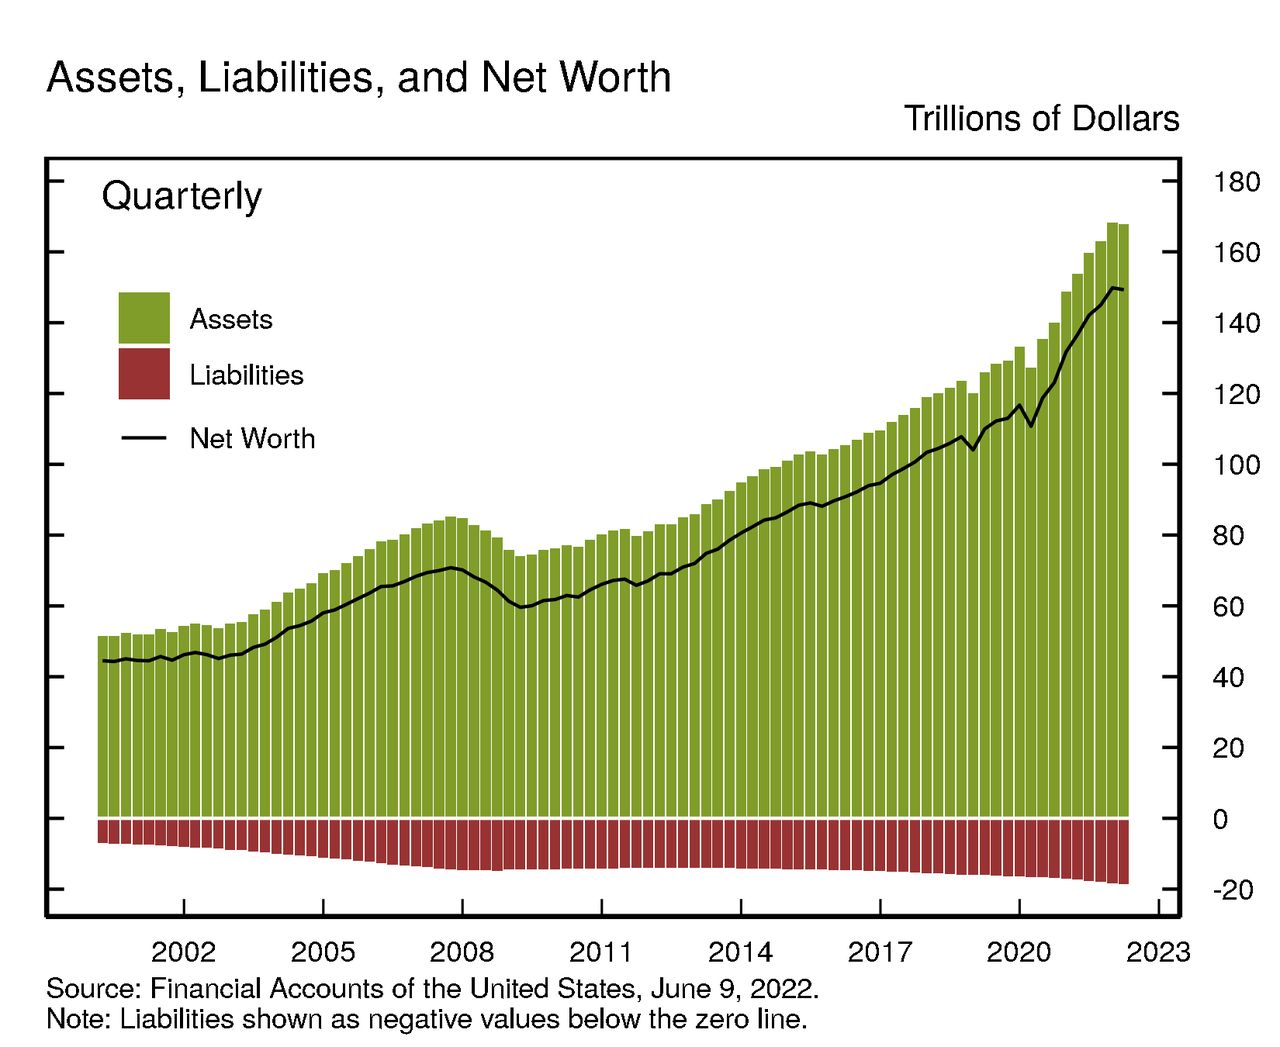
- The net worth of households and nonprofit organizations declined $0.5 trillion to $149.3 trillion in the first quarter. A sizeable $3 trillion decline in the value of stocks on the household balance sheet was partially offset by an increase in the value of real estate ($1.6 trillion) and a continued high rate of personal saving. The ratio of household net worth to disposable income was about equal to the record high of 8.2 posted last quarter and remains well above the level seen just before the pandemic in 2019.

- Directly and indirectly held corporate equities ($46.3 trillion) and household real estate ($39.7 trillion) were among the largest components of household net worth. Household debt (seasonally adjusted) was $18.3 trillion.

- Household Balance Sheet Summary
- Nonfinancial debt: Household debt grew by 8.3% in the first quarter of 2022 (this and subsequent rates of growth are reported at a seasonally adjusted annual rate), a bit higher than in the previous quarter. Home mortgages increased by 8.6% amid surging home prices, and nonmortgage consumer credit increased by 8.7%, buoyed by rapid growth in credit card borrowing and auto loans.
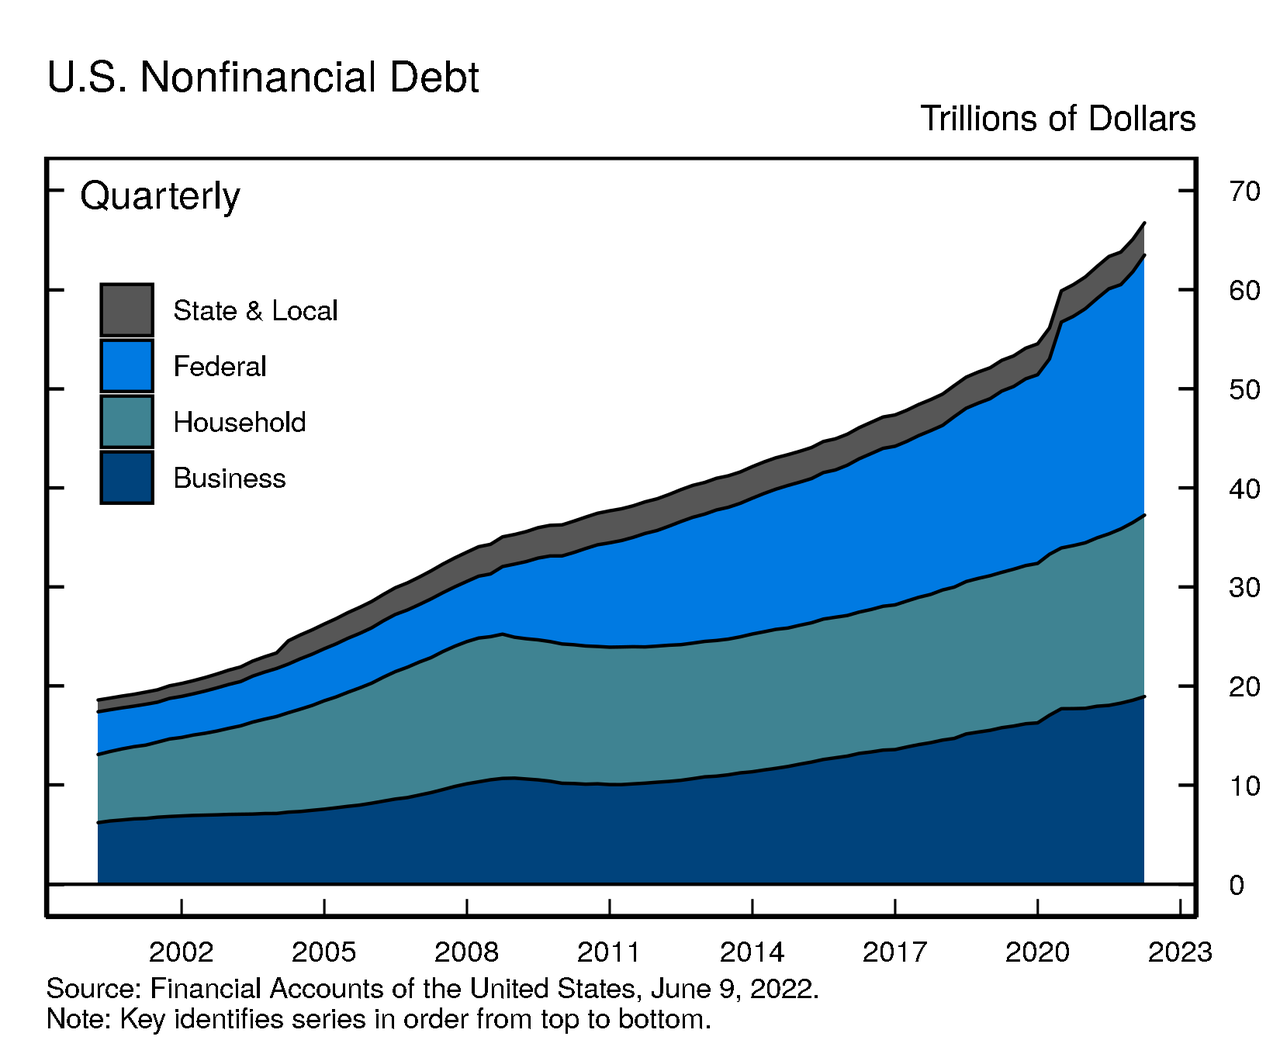
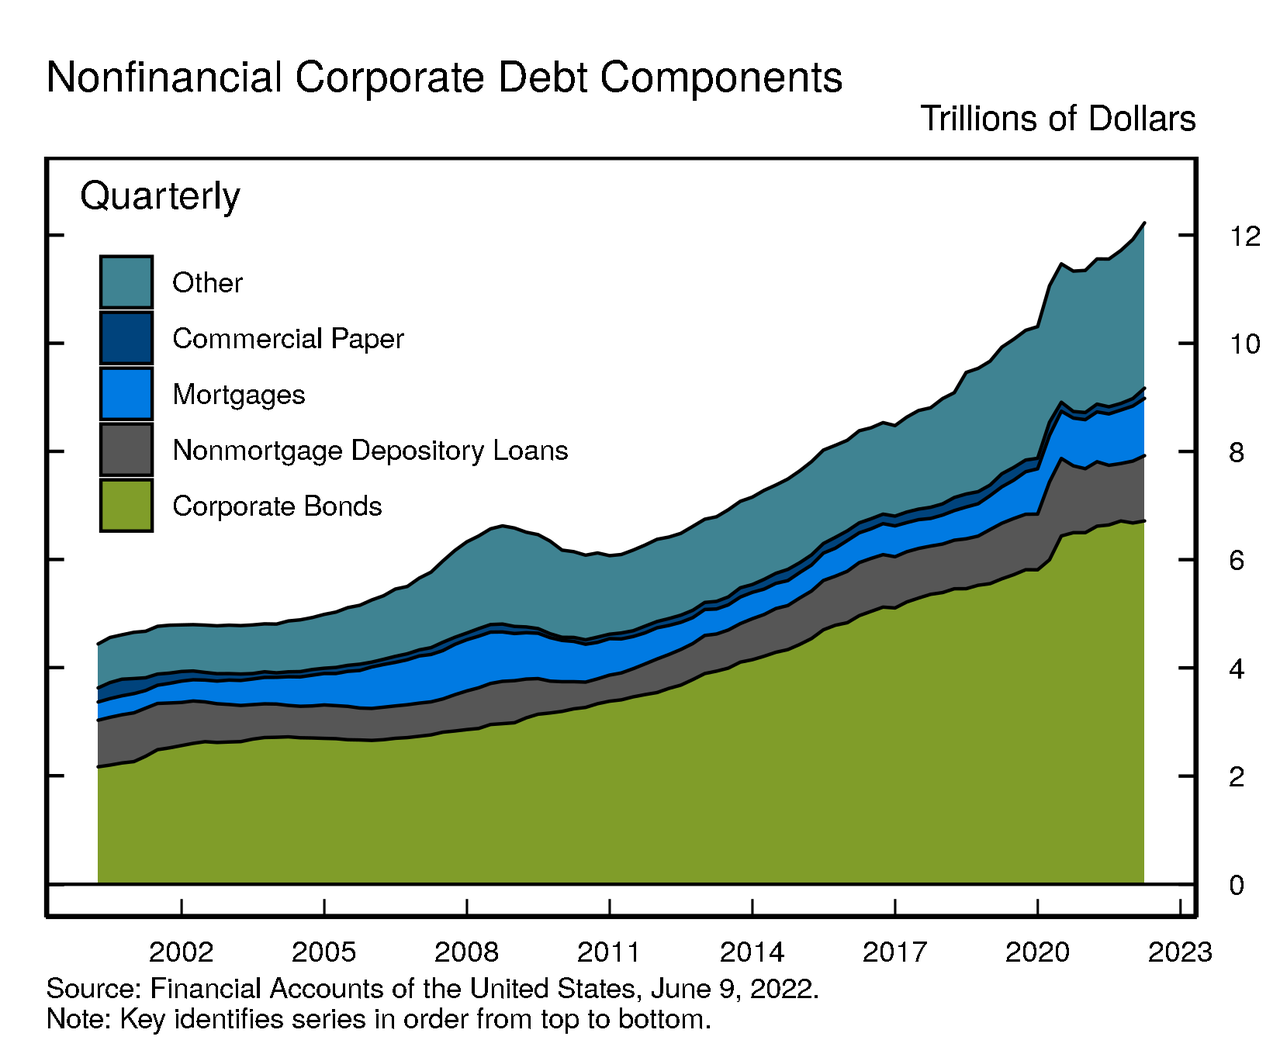
- Nonfinancial business debt grew at a rate of 8.0%, reflecting strong growth in loans, both from depository institutions and from nondepository institutions, and modest net issuance of corporate bonds. Federal debt increased by 14.9%. State and local debt decreased by 3.0%. Looking at the various components of nonfinancial business debt, nonmortgage depository loans to nonfinancial business increased by $79 billion in the first quarter. Loans from nondepository institutions also increased, as did commercial mortgages and corporate bonds outstanding. Overall, outstanding nonfinancial corporate debt was $12.2 trillion. Corporate bonds, at roughly $6.7 trillion, accounted for 55% of the total. Nonmortgage depository loans were about $1.2 trillion. Other types of debt include loans from nonbank institutions, loans from the federal government, and commercial paper.
As we said above, none of the above matters due to the clear massaging of the headline data meant to represent the economy as stronger than it is.
However, while we know that US households were much poorer than the Fed tried to represent as of March 31, what is far more ominous is what today's Flow of Funds report implied for future stock prices.
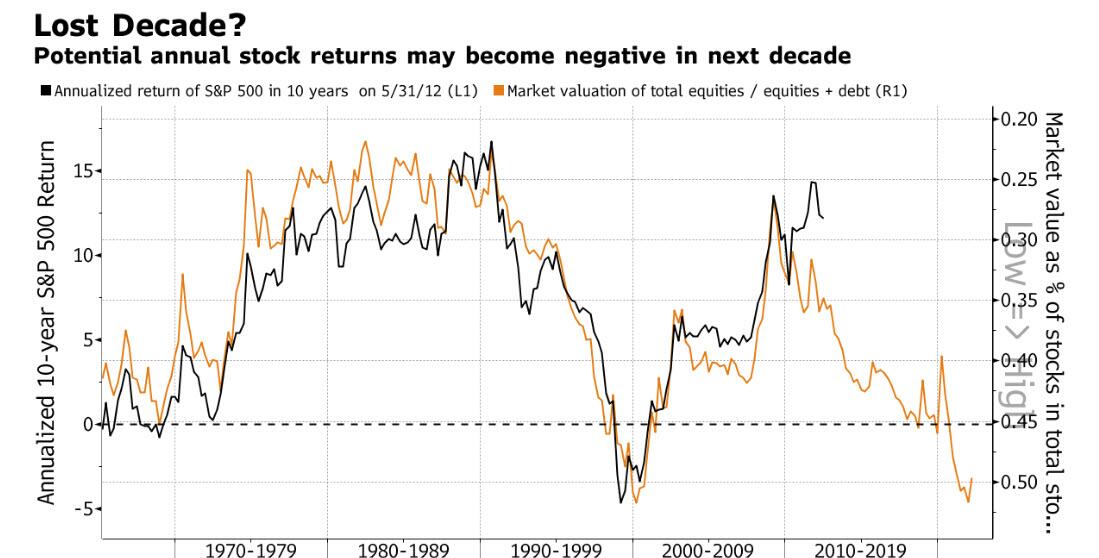
As Bloomberg's Ye Xie shows in the next chart, which as as noted previously shows a strong correlation between investor allocation to stocks over debt and the subsequent equity returns, a dismal decade is facing stocks simply because higher equity valuation has tended to lead to lower future returns.

As Xie notes, the black line above shows the annualized stock return that investors earned over the subsequent 10 years. In 1999, the line fell to about minus 5%. That means investors lost 5% a year over the following decade. Meanwhile, the (inverted) yellow line tracks the value of U.S. equities divided by the combined value of stocks and debt -- suggesting whether stocks are cheap or expensive (more here).
So where are we now? the current reading of the stock/bond valuation ratio is at the similar level of the peak of the dot.com bubble at the turn of the century. It points to sub-zero returns for the next 10 years!
Xie's conclusion: "brace for a lost decade."
Two weeks ago we calculated that based on the recent collapse in stock prices, US households have lost at least $20 trillion in net worth simply because financial assets (unlike tangible assets such as real estate) represent the vast majority of the US household balance sheet (at least that of the top 10%; the bottom 50% have virtually no assets but lots of liabilities, i.e., debt).
Today, the Fed released its quarterly Financial Accounts (also known as Flow of Funds or Z.1) statement which, among other things, gives the official estimation of household net worth for the US (along with fund flows and stock levels for all aspects of the US economy). The only problem is that as of March 31, said “calculation” was laughable, with the Fed – which clearly has gotten its pig lipsticking marching orders from the Biden admin – reporting that in the first quarter, in which stocks basically crashed into a bear market, wiping out tens of trillions in market cap, household net worth decreased by only $0.5 trillion in the first quarter, fueled by a $3 trillion drop in stock values (and offset by a $1.7 trillion increase in real estate, the same increase which the Fed is scrambling to destroy by sending mortgage rates into orbit), or visually:
This is laughable because as we noted at the end of May, just the net worth of the world’s 500 richest people had by dropped $1.6 trillion since its peak in November, as calculated by Bloomberg, with US Billionaires losing $800 billion, or more than the entire US supposedly lost in net worth in the entire first quarter.
Why would the Fed embellish yet another number? Perhaps because the Biden admin, already pounded daily on all sides by attacks its senile incompetence has sparked the worst stagflationary economic crash in 40 years, did not want to also be accused of wiping out tens of trillions in net worth. Well, the Fed may have kicked the can, but it won’t be able to do it for much longer: as the next chart shows, unless stocks make some remarkable recovery in the next 3 weeks, the Q2 net worth crash will be the biggest ever, and this time not even the Fed can do anything to make it less painful.
Laughable of not, let’s dig into the the numbers, if only for the sake of continuity, straight from he Fed:
- The net worth of households and nonprofit organizations declined $0.5 trillion to $149.3 trillion in the first quarter. A sizeable $3 trillion decline in the value of stocks on the household balance sheet was partially offset by an increase in the value of real estate ($1.6 trillion) and a continued high rate of personal saving. The ratio of household net worth to disposable income was about equal to the record high of 8.2 posted last quarter and remains well above the level seen just before the pandemic in 2019.
- Directly and indirectly held corporate equities ($46.3 trillion) and household real estate ($39.7 trillion) were among the largest components of household net worth. Household debt (seasonally adjusted) was $18.3 trillion.
- Household Balance Sheet Summary

- Nonfinancial debt: Household debt grew by 8.3% in the first quarter of 2022 (this and subsequent rates of growth are reported at a seasonally adjusted annual rate), a bit higher than in the previous quarter. Home mortgages increased by 8.6% amid surging home prices, and nonmortgage consumer credit increased by 8.7%, buoyed by rapid growth in credit card borrowing and auto loans.

- Nonfinancial business debt grew at a rate of 8.0%, reflecting strong growth in loans, both from depository institutions and from nondepository institutions, and modest net issuance of corporate bonds. Federal debt increased by 14.9%. State and local debt decreased by 3.0%. Looking at the various components of nonfinancial business debt, nonmortgage depository loans to nonfinancial business increased by $79 billion in the first quarter. Loans from nondepository institutions also increased, as did commercial mortgages and corporate bonds outstanding. Overall, outstanding nonfinancial corporate debt was $12.2 trillion. Corporate bonds, at roughly $6.7 trillion, accounted for 55% of the total. Nonmortgage depository loans were about $1.2 trillion. Other types of debt include loans from nonbank institutions, loans from the federal government, and commercial paper.

As we said above, none of the above matters due to the clear massaging of the headline data meant to represent the economy as stronger than it is.
However, while we know that US households were much poorer than the Fed tried to represent as of March 31, what is far more ominous is what today’s Flow of Funds report implied for future stock prices.
As Bloomberg’s Ye Xie shows in the next chart, which as as noted previously shows a strong correlation between investor allocation to stocks over debt and the subsequent equity returns, a dismal decade is facing stocks simply because higher equity valuation has tended to lead to lower future returns.
As Xie notes, the black line above shows the annualized stock return that investors earned over the subsequent 10 years. In 1999, the line fell to about minus 5%. That means investors lost 5% a year over the following decade. Meanwhile, the (inverted) yellow line tracks the value of U.S. equities divided by the combined value of stocks and debt — suggesting whether stocks are cheap or expensive (more here).
So where are we now? the current reading of the stock/bond valuation ratio is at the similar level of the peak of the dot.com bubble at the turn of the century. It points to sub-zero returns for the next 10 years!
Xie’s conclusion: “brace for a lost decade.”