As demographics continue to shift in the 21st century, the world’s aging population will continue to be a focal point for many global decision makers.
Visual Capitalist's Freny Fernandes notes that most countries around the world have experienced population explosions, or are about to. Combine this with declining birth rates and falling mortality rates, and it’s clear that the global senior population will continue to reach new heights.
These graphics by Pablo Alvarez use data from the 2022 UN World Population Prospects to visualize this increasing aging population across countries.

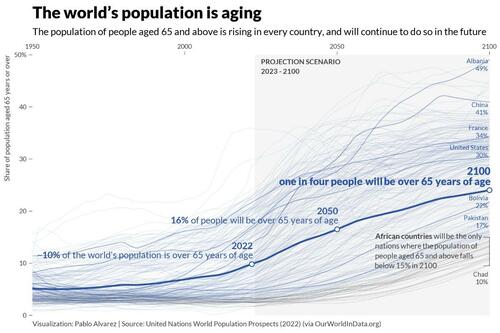
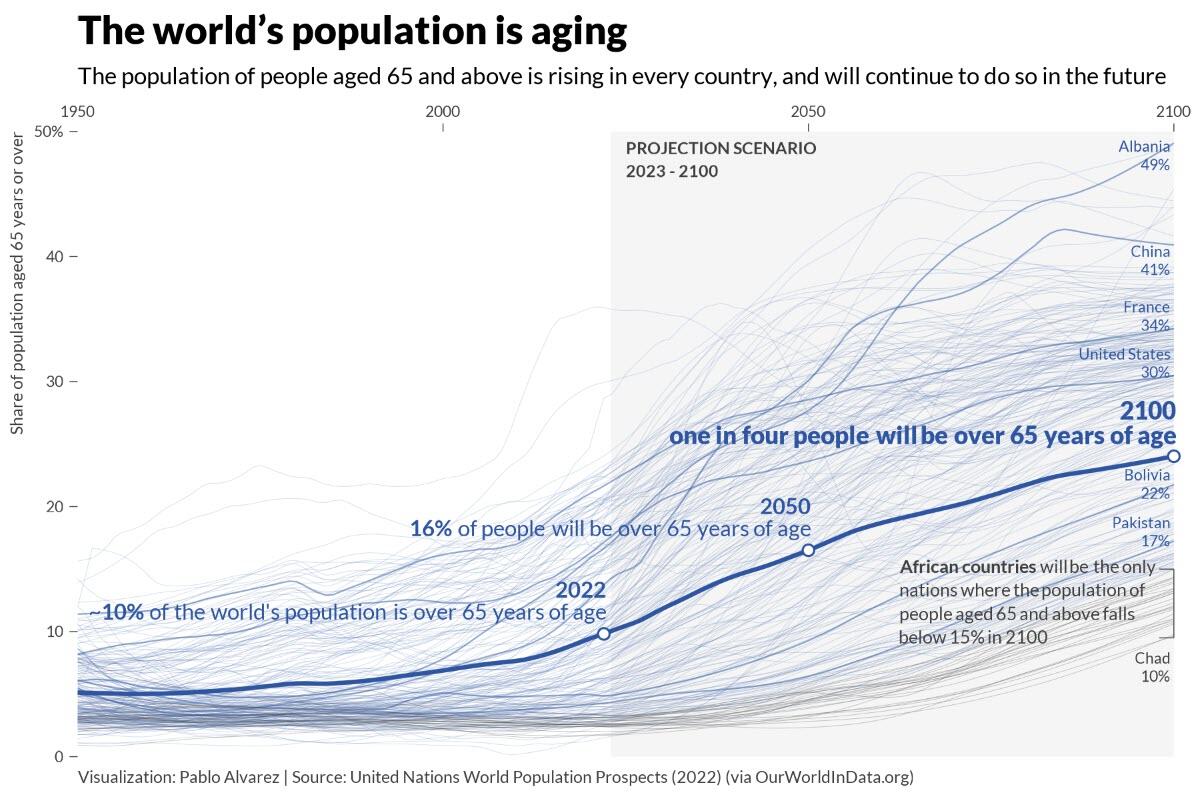
The World’s Aging Population from 1950 to 2100
In 2022, there were 771 million people aged 65+ years globally, accounting for almost 10% of the world’s population.
This segment has been growing at an increasing rate, and it’s expected to hit 16% in 2050, and eventually 24% by 2100. Here’s what that’s projected to look like, for every country and territory.
| Country by Population Aged +65 Years | 1950 | 2022 | 2100 |
|---|---|---|---|
| 🇦🇫 Afghanistan | 2.85% | 2.39% | 16.03% |
| 🇦🇱 Albania | 6.04% | 16.66% | 49.08% |
| 🇩🇿 Algeria | 3.49% | 6.39% | 28.83% |
| 🇦🇸 American Samoa | 2.38% | 7.27% | 45.41% |
| 🇦🇩 Andorra | 10.02% | 14.98% | 37.04% |
| 🇦🇴 Angola | 2.93% | 2.6% | 12.07% |
| 🇦🇮 Anguilla | 3.69% | 10.71% | 37.49% |
| 🇦🇬 Antigua and Barbuda | 4.14% | 10.63% | 35.4% |
| 🇦🇷 Argentina | 4.13% | 11.92% | 31.79% |
| 🇦🇲 Armenia | 8.17% | 13.15% | 36.13% |
| 🇦🇼 Aruba | 1.77% | 16.15% | 36.51% |
| 🇦🇺 Australia | 8.17% | 16.9% | 31.38% |
| 🇦🇹 Austria | 10.42% | 19.81% | 33.93% |
| 🇦🇿 Azerbaijan | 6.89% | 7.11% | 30.5% |
| 🇧🇸 Bahamas | 4.76% | 8.89% | 29.58% |
| 🇧🇭 Bahrain | 2.88% | 3.76% | 21.89% |
| 🇧🇩 Bangladesh | 3.9% | 6.04% | 32.56% |
| 🇧🇧 Barbados | 5.24% | 16.28% | 33.19% |
| 🇧🇾 Belarus | 8.24% | 17.18% | 30.45% |
| 🇧🇪 Belgium | 11.03% | 19.73% | 32.83% |
| 🇧🇿 Belize | 3.57% | 5.09% | 29.21% |
| 🇧🇯 Benin | 7.85% | 3.06% | 11.03% |
| 🇧🇲 Bermuda | 5.71% | 20.41% | 37.73% |
| 🇧🇹 Bhutan | 2.53% | 6.25% | 33.35% |
| 🇧🇴 Bolivia | 6.11% | 4.85% | 21.75% |
| 🇧🇶 Bonaire Sint Eustatius and Saba | 14.22% | 13.84% | 28.94% |
| 🇧🇦 Bosnia and Herzegovina | 3.95% | 18.4% | 36.4% |
| 🇧🇼 Botswana | 4.32% | 3.65% | 17.96% |
| 🇧🇷 Brazil | 2.39% | 9.88% | 33.52% |
| 🇻🇬 British Virgin Islands | 8.63% | 9.95% | 32.47% |
| 🇧🇳 Brunei | 4.85% | 6.17% | 30.93% |
| 🇧🇬 Bulgaria | 6.66% | 22.38% | 37.13% |
| 🇧🇫 Burkina Faso | 2.01% | 2.53% | 13.07% |
| 🇧🇮 Burundi | 3.22% | 2.48% | 13.23% |
| 🇰🇭 Cambodia | 2.67% | 5.81% | 26.43% |
| 🇨🇲 Cameroon | 3.47% | 2.67% | 11.89% |
| 🇨🇦 Canada | 7.7% | 19.03% | 31.55% |
| 🇨🇻 Cape Verde | 3.67% | 5.55% | 32.63% |
| 🇰🇾 Cayman Islands | 6.05% | 8.17% | 28.75% |
| 🇨🇫 Central African Republic | 5.% | 2.51% | 11.43% |
| 🇹🇩 Chad | 4.33% | 2.01% | 9.64% |
| 🇨🇱 Chile | 3.3% | 13.03% | 36.61% |
| 🇨🇳 China | 5.04% | 13.72% | 40.93% |
| 🇨🇴 Colombia | 3.22% | 9.% | 34.49% |
| 🇰🇲 Comoros | 3.8% | 4.28% | 17.81% |
| 🇨🇬 Congo | 3.36% | 2.72% | 11.99% |
| 🇨🇰 Cook Islands | 2.94% | 11.73% | 29.75% |
| 🇨🇷 Costa Rica | 2.97% | 10.83% | 36.99% |
| 🇨🇮 Cote d'Ivoire | 2.21% | 2.4% | 10.86% |
| 🇭🇷 Croatia | 7.82% | 22.36% | 37.03% |
| 🇨🇺 Cuba | 4.36% | 15.81% | 36.31% |
| 🇨🇼 Curacao | 5.82% | 14.95% | 30.46% |
| 🇨🇾 Cyprus | 5.95% | 14.83% | 33.36% |
| 🇨🇿 Czechia | 8.29% | 20.64% | 26.94% |
| 🇨🇩 Democratic Republic of Congo | 3.77% | 2.92% | 10.62% |
| 🇩🇰 Denmark | 9.04% | 20.49% | 30.45% |
| 🇩🇯 Djibouti | 1.99% | 4.54% | 19.68% |
| 🇩🇲 Dominica | 7.67% | 9.53% | 34.28% |
| 🇩🇴 Dominican Republic | 2.72% | 7.4% | 30.47% |
| 🇪🇨 Ecuador | 5.2% | 7.83% | 31.97% |
| 🇪🇬 Egypt | 2.95% | 4.83% | 21.77% |
| 🇸🇻 El Salvador | 3.93% | 8.22% | 36.02% |
| 🇬🇶 Equatorial Guinea | 5.53% | 3.12% | 15.13% |
| 🇪🇷 Eritrea | 3.2% | 4.01% | 19.86% |
| 🇪🇪 Estonia | 10.56% | 20.58% | 34.15% |
| 🇸🇿 Eswatini | 2.68% | 4.% | 16.26% |
| 🇪🇹 Ethiopia | 3.01% | 3.14% | 18.6% |
| 🇫🇴 Faeroe Islands | 7.59% | 17.92% | 26.91% |
| 🇫🇰 Falkland Islands | 8.27% | 11.08% | 35.86% |
| 🇫🇯 Fiji | 5.99% | 5.9% | 20.6% |
| 🇫🇮 Finland | 6.63% | 23.27% | 34.04% |
| 🇫🇷 France | 11.39% | 21.66% | 34.23% |
| 🇬🇫 French Guiana | 7.96% | 5.98% | 21.13% |
| 🇵🇫 French Polynesia | 3.% | 10.07% | 37.85% |
| 🇬🇦 Gabon | 7.21% | 3.89% | 16.25% |
| 🇬🇲 Gambia | 2.5% | 2.43% | 16.06% |
| 🇬🇪 Georgia | 9.35% | 14.61% | 31.19% |
| 🇩🇪 Germany | 9.46% | 22.41% | 33.72% |
| 🇬🇭 Ghana | 4.62% | 3.55% | 15.91% |
| 🇬🇮 Gibraltar | 6.94% | 20.84% | 37.63% |
| 🇬🇷 Greece | 6.8% | 22.82% | 37.52% |
| 🇬🇱 Greenland | 3.06% | 10.02% | 29.16% |
| 🇬🇩 Grenada | 5.12% | 10.07% | 30.54% |
| 🇬🇵 Guadeloupe | 5.51% | 20.04% | 34.45% |
| 🇬🇺 Guam | 1.11% | 11.84% | 31.19% |
| 🇬🇹 Guatemala | 2.31% | 4.91% | 28.05% |
| 🇬🇬 Guernsey | 11.96% | 16.64% | 35.4% |
| 🇬🇳 Guinea | 5.39% | 3.32% | 14.% |
| 🇬🇼 Guinea-Bissau | 3.45% | 2.82% | 14.34% |
| 🇬🇾 Guyana | 3.89% | 6.28% | 28.94% |
| 🇭🇹 Haiti | 3.64% | 4.54% | 19.07% |
| 🇭🇳 Honduras | 3.96% | 4.27% | 26.5% |
| 🇭🇰 Hong Kong | 2.48% | 20.47% | 41.64% |
| 🇭🇺 Hungary | 7.81% | 20.01% | 31.85% |
| 🇮🇸 Iceland | 7.52% | 15.33% | 34.25% |
| 🇮🇳 India | 3.1% | 6.9% | 29.81% |
| 🇮🇩 Indonesia | 1.74% | 6.86% | 25.28% |
| 🇮🇷 Iran | 5.22% | 7.62% | 33.72% |
| 🇮🇶 Iraq | 2.79% | 3.41% | 18.44% |
| 🇮🇪 Ireland | 10.99% | 15.14% | 32.48% |
| 🇮🇲 Isle of Man | 13.9% | 22.29% | 31.8% |
| 🇮🇱 Israel | 4.% | 12.04% | 25.97% |
| 🇮🇹 Italy | 8.09% | 24.05% | 38.19% |
| 🇯🇲 Jamaica | 3.83% | 7.45% | 44.05% |
| 🇯🇵 Japan | 4.89% | 29.92% | 38.7% |
| 🇯🇪 Jersey | 12.34% | 16.22% | 30.52% |
| 🇯🇴 Jordan | 5.03% | 3.84% | 27.3% |
| 🇰🇿 Kazakhstan | 6.47% | 8.04% | 19.58% |
| 🇰🇪 Kenya | 5.28% | 2.87% | 16.98% |
| 🇰🇮 Kiribati | 7.13% | 3.81% | 17.33% |
| 🇽🇰 Kosovo | 5.33% | 10.19% | 43.35% |
| 🇰🇼 Kuwait | 2.88% | 4.93% | 31.56% |
| 🇰🇬 Kyrgyzstan | 7.91% | 4.54% | 21.08% |
| 🇱🇦 Laos | 2.13% | 4.45% | 25.24% |
| 🇱🇻 Latvia | 10.12% | 21.86% | 32.86% |
| 🇱🇧 Lebanon | 7.24% | 9.89% | 32.11% |
| 🇱🇸 Lesotho | 6.34% | 4.2% | 13.44% |
| 🇱🇷 Liberia | 2.97% | 3.31% | 13.88% |
| 🇱🇾 Libya | 5.21% | 4.86% | 27.77% |
| 🇱🇮 Liechtenstein | 7.89% | 19.37% | 34.79% |
| 🇱🇹 Lithuania | 8.65% | 20.8% | 32.79% |
| 🇱🇺 Luxembourg | 9.71% | 15.03% | 31.55% |
| 🇲🇴 Macao | 3.11% | 13.% | 32.39% |
| 🇲🇬 Madagascar | 3.25% | 3.35% | 16.21% |
| 🇲🇼 Malawi | 3.06% | 2.61% | 15.61% |
| 🇲🇾 Malaysia | 4.91% | 7.5% | 30.78% |
| 🇲🇻 Maldives | 3.14% | 4.78% | 35.61% |
| 🇲🇱 Mali | 2.78% | 2.38% | 11.% |
| 🇲🇹 Malta | 7.42% | 19.13% | 38.26% |
| 🇲🇭 Marshall Islands | 5.68% | 4.56% | 17.8% |
| 🇲🇶 Martinique | 5.85% | 22.77% | 37.31% |
| 🇲🇷 Mauritania | 1.44% | 3.22% | 15.03% |
| 🇲🇺 Mauritius | 3.18% | 12.79% | 33.76% |
| 🇾🇹 Mayotte | 6.61% | 2.88% | 18.15% |
| 🇲🇽 Mexico | 2.99% | 8.32% | 34.88% |
| 🇫🇲 Micronesia (country) | 4.11% | 6.16% | 27.59% |
| 🇲🇩 Moldova | 7.56% | 12.98% | 26.36% |
| 🇲🇨 Monaco | 15.64% | 35.92% | 30.16% |
| 🇲🇳 Mongolia | 3.87% | 4.61% | 26.18% |
| 🇲🇪 Montenegro | 7.85% | 16.55% | 34.16% |
| 🇲🇸 Montserrat | 7.92% | 17.7% | 33.05% |
| 🇲🇦 Morocco | 2.86% | 7.72% | 29.97% |
| 🇲🇿 Mozambique | 3.13% | 2.57% | 13.43% |
| 🇲🇲 Myanmar | 3.21% | 6.82% | 23.69% |
| 🇳🇦 Namibia | 4.1% | 3.97% | 15.38% |
| 🇳🇷 Nauru | 8.98% | 2.5% | 15.87% |
| 🇳🇵 Nepal | 2.74% | 6.09% | 29.51% |
| 🇳🇱 Netherlands | 7.76% | 20.31% | 32.89% |
| 🇳🇨 New Caledonia | 5.% | 11.02% | 31.61% |
| 🇳🇿 New Zealand | 9.09% | 16.31% | 33.2% |
| 🇳🇮 Nicaragua | 2.71% | 5.29% | 28.92% |
| 🇳🇪 Niger | .92% | 2.4% | 9.76% |
| 🇳🇬 Nigeria | 3.% | 2.97% | 12.31% |
| 🇳🇺 Niue | 4.79% | 15.16% | 22.55% |
| 🇰🇵 North Korea | 2.72% | 11.71% | 30.49% |
| 🇲🇰 North Macedonia | 5.87% | 14.91% | 36.56% |
| 🇲🇵 Northern Mariana Islands | 2.95% | 10.81% | 32.09% |
| 🇳🇴 Norway | 9.52% | 18.44% | 31.65% |
| 🇴🇲 Oman | 3.05% | 2.76% | 23.96% |
| 🇵🇰 Pakistan | 5.48% | 4.27% | 17.23% |
| 🇵🇼 Palau | 8.59% | 9.93% | 21.48% |
| 🇵🇸 Palestine | 4.77% | 3.53% | 23.44% |
| 🇵🇦 Panama | 3.57% | 8.77% | 30.03% |
| 🇵🇬 Papua New Guinea | 1.09% | 3.19% | 16.81% |
| 🇵🇾 Paraguay | 3.73% | 6.26% | 26.51% |
| 🇵🇪 Peru | 3.43% | 8.41% | 30.33% |
| 🇵🇭 Philippines | 3.56% | 5.44% | 23.38% |
| 🇵🇱 Poland | 5.22% | 18.55% | 35.69% |
| 🇵🇹 Portugal | 7.% | 22.9% | 36.28% |
| 🇵🇷 Puerto Rico | 3.63% | 22.93% | 48.9% |
| 🇶🇦 Qatar | 3.5% | 1.52% | 15.01% |
| 🇷🇪 Reunion | 3.81% | 13.28% | 32.4% |
| 🇷🇴 Romania | 7.16% | 18.64% | 32.22% |
| 🇷🇺 Russia | 4.8% | 15.8% | 27.86% |
| 🇷🇼 Rwanda | 2.76% | 3.2% | 17.36% |
| 🇧🇱 Saint Barthlemy | 7.3% | 10.61% | 43.89% |
| 🇸🇭 Saint Helena | 8.63% | 28.66% | 32.61% |
| 🇰🇳 Saint Kitts and Nevis | 5.36% | 10.13% | 29.79% |
| 🇱🇨 Saint Lucia | 3.59% | 9.23% | 33.39% |
| 🇲🇫 Saint Martin (French part) | 4.47% | 11.14% | 30.08% |
| 🇵🇲 Saint Pierre and Miquelon | 6.34% | 17.32% | 33.4% |
| 🇻🇨 Saint Vincent and the Grenadines | 7.71% | 10.86% | 32.34% |
| 🇼🇸 Samoa | 2.52% | 5.22% | 18.75% |
| 🇸🇲 San Marino | 10.15% | 20.47% | 35.73% |
| 🇸🇹 Sao Tome and Principe | 3.92% | 3.76% | 15.6% |
| 🇸🇦 Saudi Arabia | 3.32% | 2.81% | 30.28% |
| 🇸🇳 Senegal | 3.42% | 3.14% | 16.54% |
| 🇷🇸 Serbia | 6.15% | 20.56% | 37.55% |
| 🇸🇨 Seychelles | 10.68% | 8.16% | 28.84% |
| 🇸🇱 Sierra Leone | 3.02% | 3.14% | 15.52% |
| 🇸🇬 Singapore | 2.29% | 15.12% | 36.51% |
| 🇸🇽 Sint Maarten (Dutch part) | 12.03% | 10.57% | 34.51% |
| 🇸🇰 Slovakia | 6.63% | 16.98% | 33.4% |
| 🇸🇮 Slovenia | 7.52% | 20.96% | 33.59% |
| 🇸🇧 Solomon Islands | 4.03% | 3.47% | 15.29% |
| 🇸🇴 Somalia | 2.6% | 2.57% | 10.75% |
| 🇿🇦 South Africa | 4.06% | 5.89% | 20.55% |
| 🇰🇷 South Korea | 2.74% | 17.49% | 44.44% |
| 🇸🇸 South Sudan | 3.48% | 2.89% | 13.11% |
| 🇪🇸 Spain | 7.23% | 20.27% | 38.72% |
| 🇱🇰 Sri Lanka | 8.76% | 11.54% | 35.73% |
| 🇸🇩 Sudan | 3.03% | 3.5% | 13.28% |
| 🇸🇷 Suriname | 4.09% | 7.39% | 25.8% |
| 🇸🇪 Sweden | 10.19% | 20.25% | 31.83% |
| 🇨🇭 Switzerland | 9.49% | 19.31% | 32.61% |
| 🇸🇾 Syria | 7.66% | 4.68% | 24.62% |
| 🇹🇼 Taiwan | 2.11% | 16.71% | 37.32% |
| 🇹🇯 Tajikistan | 4.34% | 3.47% | 19.43% |
| 🇹🇿 Tanzania | 2.2% | 3.1% | 14.97% |
| 🇹🇭 Thailand | 3.21% | 15.21% | 39.17% |
| 🇹🇱 Timor | 3.14% | 5.21% | 25.42% |
| 🇹🇬 Togo | 4.29% | 3.13% | 11.77% |
| 🇹🇰 Tokelau | 4.7% | 8.66% | 25.03% |
| 🇹🇴 Tonga | 4.6% | 6.22% | 21.65% |
| 🇹🇹 Trinidad and Tobago | 3.93% | 11.52% | 32.67% |
| 🇹🇳 Tunisia | 4.4% | 9.02% | 31.24% |
| 🇹🇷 Turkey | 3.77% | 8.64% | 33.9% |
| 🇹🇲 Turkmenistan | 5.84% | 5.15% | 21.55% |
| 🇹🇨 Turks and Caicos Islands | 5.79% | 10.34% | 28.25% |
| 🇹🇻 Tuvalu | 4.98% | 6.48% | 16.15% |
| 🇺🇬 Uganda | 2.87% | 1.69% | 14.33% |
| 🇺🇦 Ukraine | 7.54% | 18.81% | 33.2% |
| 🇦🇪 United Arab Emirates | 3.35% | 1.83% | 15.77% |
| 🇬🇧 United Kingdom | 10.84% | 19.17% | 32.56% |
| 🇺🇸 United States | 8.18% | 17.13% | 30.47% |
| 🇻🇮 United States Virgin Islands | 7.54% | 20.42% | 39.11% |
| 🇺🇾 Uruguay | 8.23% | 15.58% | 35.98% |
| 🇺🇿 Uzbekistan | 5.87% | 5.14% | 22.24% |
| 🇻🇺 Vanuatu | 5.65% | 3.74% | 16.29% |
| 🇻🇪 Venezuela | 2.29% | 8.61% | 27.71% |
| 🇻🇳 Vietnam | 4.13% | 9.12% | 30.02% |
| 🇼🇫 Wallis and Futuna | 1.76% | 13.47% | 32.98% |
| 🇪🇭 Western Sahara | 2.82% | 5.84% | 23.73% |
| 🇾🇪 Yemen | 3.98% | 2.66% | 18.25% |
| 🇿🇲 Zambia | 2.76% | 1.75% | 12.66% |
| 🇿🇼 Zimbabwe | 3.18% | 3.32% | 14.22% |
| 🌐 World | 5.13% | 9.82% | 24.03% |
Some of the places with high elderly shares today include high-income countries like Japan (30%), Italy (24%), and Finland (23%).
The lowest shares are concentrated in the Middle East and Africa. Many countries have just 2% of their population aged 65 years and older, such as Qatar, Uganda, and Afghanistan.
But over time, almost all countries are expected to see their older population segments grow. In just three decades, it is estimated that one-in-four European, North American, and Asian residents will be over 65 years of age.
By 2100, a variety of Asian countries and island nations facing low population growth are expected to see more than one-third of their populations aged 65 years or older, including South Korea and Jamaica at 44%. However, it’s actually Albania that’s the biggest outlier overall, with a projected 49% of its population to be aged 65 and older by 2100.
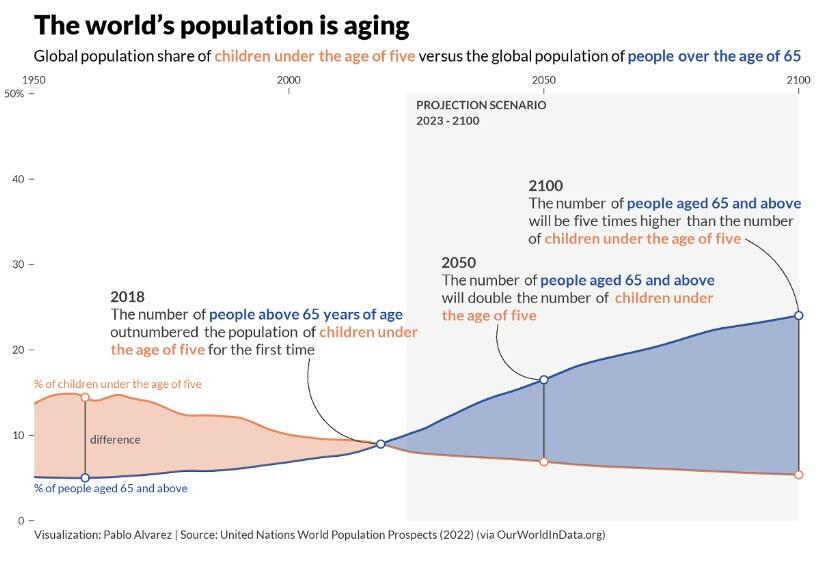
Passing the Generational Torch
The challenge of an aging population is set to impact all sectors of society, including labor and financial markets, demand for housing and transportation, and especially family structures and intergenerational ties.
One way to help grasp the nature of transition is to note the changing ratio between seniors and young children in the world population, as seen in the below crossover diagram:

Dropping fertility rates, in addition to improved child and infant mortality rates, are known to have played a major role in the plateauing population of children.
However, not all countries have witnessed this crossover yet, as it usually coincides with higher levels of economic development.
As countries such as India, Brazil, and South Africa reach higher levels of per capita income, they will be likely to follow down the paths of more advanced economies, eventually experiencing similar demographic fates and challenges.
As demographics continue to shift in the 21st century, the world’s aging population will continue to be a focal point for many global decision makers.
Visual Capitalist’s Freny Fernandes notes that most countries around the world have experienced population explosions, or are about to. Combine this with declining birth rates and falling mortality rates, and it’s clear that the global senior population will continue to reach new heights.
These graphics by Pablo Alvarez use data from the 2022 UN World Population Prospects to visualize this increasing aging population across countries.
The World’s Aging Population from 1950 to 2100
In 2022, there were 771 million people aged 65+ years globally, accounting for almost 10% of the world’s population.
This segment has been growing at an increasing rate, and it’s expected to hit 16% in 2050, and eventually 24% by 2100. Here’s what that’s projected to look like, for every country and territory.
| Country by Population Aged +65 Years | 1950 | 2022 | 2100 |
|---|---|---|---|
| 🇦🇫 Afghanistan | 2.85% | 2.39% | 16.03% |
| 🇦🇱 Albania | 6.04% | 16.66% | 49.08% |
| 🇩🇿 Algeria | 3.49% | 6.39% | 28.83% |
| 🇦🇸 American Samoa | 2.38% | 7.27% | 45.41% |
| 🇦🇩 Andorra | 10.02% | 14.98% | 37.04% |
| 🇦🇴 Angola | 2.93% | 2.6% | 12.07% |
| 🇦🇮 Anguilla | 3.69% | 10.71% | 37.49% |
| 🇦🇬 Antigua and Barbuda | 4.14% | 10.63% | 35.4% |
| 🇦🇷 Argentina | 4.13% | 11.92% | 31.79% |
| 🇦🇲 Armenia | 8.17% | 13.15% | 36.13% |
| 🇦🇼 Aruba | 1.77% | 16.15% | 36.51% |
| 🇦🇺 Australia | 8.17% | 16.9% | 31.38% |
| 🇦🇹 Austria | 10.42% | 19.81% | 33.93% |
| 🇦🇿 Azerbaijan | 6.89% | 7.11% | 30.5% |
| 🇧🇸 Bahamas | 4.76% | 8.89% | 29.58% |
| 🇧🇭 Bahrain | 2.88% | 3.76% | 21.89% |
| 🇧🇩 Bangladesh | 3.9% | 6.04% | 32.56% |
| 🇧🇧 Barbados | 5.24% | 16.28% | 33.19% |
| 🇧🇾 Belarus | 8.24% | 17.18% | 30.45% |
| 🇧🇪 Belgium | 11.03% | 19.73% | 32.83% |
| 🇧🇿 Belize | 3.57% | 5.09% | 29.21% |
| 🇧🇯 Benin | 7.85% | 3.06% | 11.03% |
| 🇧🇲 Bermuda | 5.71% | 20.41% | 37.73% |
| 🇧🇹 Bhutan | 2.53% | 6.25% | 33.35% |
| 🇧🇴 Bolivia | 6.11% | 4.85% | 21.75% |
| 🇧🇶 Bonaire Sint Eustatius and Saba | 14.22% | 13.84% | 28.94% |
| 🇧🇦 Bosnia and Herzegovina | 3.95% | 18.4% | 36.4% |
| 🇧🇼 Botswana | 4.32% | 3.65% | 17.96% |
| 🇧🇷 Brazil | 2.39% | 9.88% | 33.52% |
| 🇻🇬 British Virgin Islands | 8.63% | 9.95% | 32.47% |
| 🇧🇳 Brunei | 4.85% | 6.17% | 30.93% |
| 🇧🇬 Bulgaria | 6.66% | 22.38% | 37.13% |
| 🇧🇫 Burkina Faso | 2.01% | 2.53% | 13.07% |
| 🇧🇮 Burundi | 3.22% | 2.48% | 13.23% |
| 🇰🇭 Cambodia | 2.67% | 5.81% | 26.43% |
| 🇨🇲 Cameroon | 3.47% | 2.67% | 11.89% |
| 🇨🇦 Canada | 7.7% | 19.03% | 31.55% |
| 🇨🇻 Cape Verde | 3.67% | 5.55% | 32.63% |
| 🇰🇾 Cayman Islands | 6.05% | 8.17% | 28.75% |
| 🇨🇫 Central African Republic | 5.% | 2.51% | 11.43% |
| 🇹🇩 Chad | 4.33% | 2.01% | 9.64% |
| 🇨🇱 Chile | 3.3% | 13.03% | 36.61% |
| 🇨🇳 China | 5.04% | 13.72% | 40.93% |
| 🇨🇴 Colombia | 3.22% | 9.% | 34.49% |
| 🇰🇲 Comoros | 3.8% | 4.28% | 17.81% |
| 🇨🇬 Congo | 3.36% | 2.72% | 11.99% |
| 🇨🇰 Cook Islands | 2.94% | 11.73% | 29.75% |
| 🇨🇷 Costa Rica | 2.97% | 10.83% | 36.99% |
| 🇨🇮 Cote d’Ivoire | 2.21% | 2.4% | 10.86% |
| 🇭🇷 Croatia | 7.82% | 22.36% | 37.03% |
| 🇨🇺 Cuba | 4.36% | 15.81% | 36.31% |
| 🇨🇼 Curacao | 5.82% | 14.95% | 30.46% |
| 🇨🇾 Cyprus | 5.95% | 14.83% | 33.36% |
| 🇨🇿 Czechia | 8.29% | 20.64% | 26.94% |
| 🇨🇩 Democratic Republic of Congo | 3.77% | 2.92% | 10.62% |
| 🇩🇰 Denmark | 9.04% | 20.49% | 30.45% |
| 🇩🇯 Djibouti | 1.99% | 4.54% | 19.68% |
| 🇩🇲 Dominica | 7.67% | 9.53% | 34.28% |
| 🇩🇴 Dominican Republic | 2.72% | 7.4% | 30.47% |
| 🇪🇨 Ecuador | 5.2% | 7.83% | 31.97% |
| 🇪🇬 Egypt | 2.95% | 4.83% | 21.77% |
| 🇸🇻 El Salvador | 3.93% | 8.22% | 36.02% |
| 🇬🇶 Equatorial Guinea | 5.53% | 3.12% | 15.13% |
| 🇪🇷 Eritrea | 3.2% | 4.01% | 19.86% |
| 🇪🇪 Estonia | 10.56% | 20.58% | 34.15% |
| 🇸🇿 Eswatini | 2.68% | 4.% | 16.26% |
| 🇪🇹 Ethiopia | 3.01% | 3.14% | 18.6% |
| 🇫🇴 Faeroe Islands | 7.59% | 17.92% | 26.91% |
| 🇫🇰 Falkland Islands | 8.27% | 11.08% | 35.86% |
| 🇫🇯 Fiji | 5.99% | 5.9% | 20.6% |
| 🇫🇮 Finland | 6.63% | 23.27% | 34.04% |
| 🇫🇷 France | 11.39% | 21.66% | 34.23% |
| 🇬🇫 French Guiana | 7.96% | 5.98% | 21.13% |
| 🇵🇫 French Polynesia | 3.% | 10.07% | 37.85% |
| 🇬🇦 Gabon | 7.21% | 3.89% | 16.25% |
| 🇬🇲 Gambia | 2.5% | 2.43% | 16.06% |
| 🇬🇪 Georgia | 9.35% | 14.61% | 31.19% |
| 🇩🇪 Germany | 9.46% | 22.41% | 33.72% |
| 🇬🇭 Ghana | 4.62% | 3.55% | 15.91% |
| 🇬🇮 Gibraltar | 6.94% | 20.84% | 37.63% |
| 🇬🇷 Greece | 6.8% | 22.82% | 37.52% |
| 🇬🇱 Greenland | 3.06% | 10.02% | 29.16% |
| 🇬🇩 Grenada | 5.12% | 10.07% | 30.54% |
| 🇬🇵 Guadeloupe | 5.51% | 20.04% | 34.45% |
| 🇬🇺 Guam | 1.11% | 11.84% | 31.19% |
| 🇬🇹 Guatemala | 2.31% | 4.91% | 28.05% |
| 🇬🇬 Guernsey | 11.96% | 16.64% | 35.4% |
| 🇬🇳 Guinea | 5.39% | 3.32% | 14.% |
| 🇬🇼 Guinea-Bissau | 3.45% | 2.82% | 14.34% |
| 🇬🇾 Guyana | 3.89% | 6.28% | 28.94% |
| 🇭🇹 Haiti | 3.64% | 4.54% | 19.07% |
| 🇭🇳 Honduras | 3.96% | 4.27% | 26.5% |
| 🇭🇰 Hong Kong | 2.48% | 20.47% | 41.64% |
| 🇭🇺 Hungary | 7.81% | 20.01% | 31.85% |
| 🇮🇸 Iceland | 7.52% | 15.33% | 34.25% |
| 🇮🇳 India | 3.1% | 6.9% | 29.81% |
| 🇮🇩 Indonesia | 1.74% | 6.86% | 25.28% |
| 🇮🇷 Iran | 5.22% | 7.62% | 33.72% |
| 🇮🇶 Iraq | 2.79% | 3.41% | 18.44% |
| 🇮🇪 Ireland | 10.99% | 15.14% | 32.48% |
| 🇮🇲 Isle of Man | 13.9% | 22.29% | 31.8% |
| 🇮🇱 Israel | 4.% | 12.04% | 25.97% |
| 🇮🇹 Italy | 8.09% | 24.05% | 38.19% |
| 🇯🇲 Jamaica | 3.83% | 7.45% | 44.05% |
| 🇯🇵 Japan | 4.89% | 29.92% | 38.7% |
| 🇯🇪 Jersey | 12.34% | 16.22% | 30.52% |
| 🇯🇴 Jordan | 5.03% | 3.84% | 27.3% |
| 🇰🇿 Kazakhstan | 6.47% | 8.04% | 19.58% |
| 🇰🇪 Kenya | 5.28% | 2.87% | 16.98% |
| 🇰🇮 Kiribati | 7.13% | 3.81% | 17.33% |
| 🇽🇰 Kosovo | 5.33% | 10.19% | 43.35% |
| 🇰🇼 Kuwait | 2.88% | 4.93% | 31.56% |
| 🇰🇬 Kyrgyzstan | 7.91% | 4.54% | 21.08% |
| 🇱🇦 Laos | 2.13% | 4.45% | 25.24% |
| 🇱🇻 Latvia | 10.12% | 21.86% | 32.86% |
| 🇱🇧 Lebanon | 7.24% | 9.89% | 32.11% |
| 🇱🇸 Lesotho | 6.34% | 4.2% | 13.44% |
| 🇱🇷 Liberia | 2.97% | 3.31% | 13.88% |
| 🇱🇾 Libya | 5.21% | 4.86% | 27.77% |
| 🇱🇮 Liechtenstein | 7.89% | 19.37% | 34.79% |
| 🇱🇹 Lithuania | 8.65% | 20.8% | 32.79% |
| 🇱🇺 Luxembourg | 9.71% | 15.03% | 31.55% |
| 🇲🇴 Macao | 3.11% | 13.% | 32.39% |
| 🇲🇬 Madagascar | 3.25% | 3.35% | 16.21% |
| 🇲🇼 Malawi | 3.06% | 2.61% | 15.61% |
| 🇲🇾 Malaysia | 4.91% | 7.5% | 30.78% |
| 🇲🇻 Maldives | 3.14% | 4.78% | 35.61% |
| 🇲🇱 Mali | 2.78% | 2.38% | 11.% |
| 🇲🇹 Malta | 7.42% | 19.13% | 38.26% |
| 🇲🇭 Marshall Islands | 5.68% | 4.56% | 17.8% |
| 🇲🇶 Martinique | 5.85% | 22.77% | 37.31% |
| 🇲🇷 Mauritania | 1.44% | 3.22% | 15.03% |
| 🇲🇺 Mauritius | 3.18% | 12.79% | 33.76% |
| 🇾🇹 Mayotte | 6.61% | 2.88% | 18.15% |
| 🇲🇽 Mexico | 2.99% | 8.32% | 34.88% |
| 🇫🇲 Micronesia (country) | 4.11% | 6.16% | 27.59% |
| 🇲🇩 Moldova | 7.56% | 12.98% | 26.36% |
| 🇲🇨 Monaco | 15.64% | 35.92% | 30.16% |
| 🇲🇳 Mongolia | 3.87% | 4.61% | 26.18% |
| 🇲🇪 Montenegro | 7.85% | 16.55% | 34.16% |
| 🇲🇸 Montserrat | 7.92% | 17.7% | 33.05% |
| 🇲🇦 Morocco | 2.86% | 7.72% | 29.97% |
| 🇲🇿 Mozambique | 3.13% | 2.57% | 13.43% |
| 🇲🇲 Myanmar | 3.21% | 6.82% | 23.69% |
| 🇳🇦 Namibia | 4.1% | 3.97% | 15.38% |
| 🇳🇷 Nauru | 8.98% | 2.5% | 15.87% |
| 🇳🇵 Nepal | 2.74% | 6.09% | 29.51% |
| 🇳🇱 Netherlands | 7.76% | 20.31% | 32.89% |
| 🇳🇨 New Caledonia | 5.% | 11.02% | 31.61% |
| 🇳🇿 New Zealand | 9.09% | 16.31% | 33.2% |
| 🇳🇮 Nicaragua | 2.71% | 5.29% | 28.92% |
| 🇳🇪 Niger | .92% | 2.4% | 9.76% |
| 🇳🇬 Nigeria | 3.% | 2.97% | 12.31% |
| 🇳🇺 Niue | 4.79% | 15.16% | 22.55% |
| 🇰🇵 North Korea | 2.72% | 11.71% | 30.49% |
| 🇲🇰 North Macedonia | 5.87% | 14.91% | 36.56% |
| 🇲🇵 Northern Mariana Islands | 2.95% | 10.81% | 32.09% |
| 🇳🇴 Norway | 9.52% | 18.44% | 31.65% |
| 🇴🇲 Oman | 3.05% | 2.76% | 23.96% |
| 🇵🇰 Pakistan | 5.48% | 4.27% | 17.23% |
| 🇵🇼 Palau | 8.59% | 9.93% | 21.48% |
| 🇵🇸 Palestine | 4.77% | 3.53% | 23.44% |
| 🇵🇦 Panama | 3.57% | 8.77% | 30.03% |
| 🇵🇬 Papua New Guinea | 1.09% | 3.19% | 16.81% |
| 🇵🇾 Paraguay | 3.73% | 6.26% | 26.51% |
| 🇵🇪 Peru | 3.43% | 8.41% | 30.33% |
| 🇵🇭 Philippines | 3.56% | 5.44% | 23.38% |
| 🇵🇱 Poland | 5.22% | 18.55% | 35.69% |
| 🇵🇹 Portugal | 7.% | 22.9% | 36.28% |
| 🇵🇷 Puerto Rico | 3.63% | 22.93% | 48.9% |
| 🇶🇦 Qatar | 3.5% | 1.52% | 15.01% |
| 🇷🇪 Reunion | 3.81% | 13.28% | 32.4% |
| 🇷🇴 Romania | 7.16% | 18.64% | 32.22% |
| 🇷🇺 Russia | 4.8% | 15.8% | 27.86% |
| 🇷🇼 Rwanda | 2.76% | 3.2% | 17.36% |
| 🇧🇱 Saint Barthlemy | 7.3% | 10.61% | 43.89% |
| 🇸🇭 Saint Helena | 8.63% | 28.66% | 32.61% |
| 🇰🇳 Saint Kitts and Nevis | 5.36% | 10.13% | 29.79% |
| 🇱🇨 Saint Lucia | 3.59% | 9.23% | 33.39% |
| 🇲🇫 Saint Martin (French part) | 4.47% | 11.14% | 30.08% |
| 🇵🇲 Saint Pierre and Miquelon | 6.34% | 17.32% | 33.4% |
| 🇻🇨 Saint Vincent and the Grenadines | 7.71% | 10.86% | 32.34% |
| 🇼🇸 Samoa | 2.52% | 5.22% | 18.75% |
| 🇸🇲 San Marino | 10.15% | 20.47% | 35.73% |
| 🇸🇹 Sao Tome and Principe | 3.92% | 3.76% | 15.6% |
| 🇸🇦 Saudi Arabia | 3.32% | 2.81% | 30.28% |
| 🇸🇳 Senegal | 3.42% | 3.14% | 16.54% |
| 🇷🇸 Serbia | 6.15% | 20.56% | 37.55% |
| 🇸🇨 Seychelles | 10.68% | 8.16% | 28.84% |
| 🇸🇱 Sierra Leone | 3.02% | 3.14% | 15.52% |
| 🇸🇬 Singapore | 2.29% | 15.12% | 36.51% |
| 🇸🇽 Sint Maarten (Dutch part) | 12.03% | 10.57% | 34.51% |
| 🇸🇰 Slovakia | 6.63% | 16.98% | 33.4% |
| 🇸🇮 Slovenia | 7.52% | 20.96% | 33.59% |
| 🇸🇧 Solomon Islands | 4.03% | 3.47% | 15.29% |
| 🇸🇴 Somalia | 2.6% | 2.57% | 10.75% |
| 🇿🇦 South Africa | 4.06% | 5.89% | 20.55% |
| 🇰🇷 South Korea | 2.74% | 17.49% | 44.44% |
| 🇸🇸 South Sudan | 3.48% | 2.89% | 13.11% |
| 🇪🇸 Spain | 7.23% | 20.27% | 38.72% |
| 🇱🇰 Sri Lanka | 8.76% | 11.54% | 35.73% |
| 🇸🇩 Sudan | 3.03% | 3.5% | 13.28% |
| 🇸🇷 Suriname | 4.09% | 7.39% | 25.8% |
| 🇸🇪 Sweden | 10.19% | 20.25% | 31.83% |
| 🇨🇭 Switzerland | 9.49% | 19.31% | 32.61% |
| 🇸🇾 Syria | 7.66% | 4.68% | 24.62% |
| 🇹🇼 Taiwan | 2.11% | 16.71% | 37.32% |
| 🇹🇯 Tajikistan | 4.34% | 3.47% | 19.43% |
| 🇹🇿 Tanzania | 2.2% | 3.1% | 14.97% |
| 🇹🇭 Thailand | 3.21% | 15.21% | 39.17% |
| 🇹🇱 Timor | 3.14% | 5.21% | 25.42% |
| 🇹🇬 Togo | 4.29% | 3.13% | 11.77% |
| 🇹🇰 Tokelau | 4.7% | 8.66% | 25.03% |
| 🇹🇴 Tonga | 4.6% | 6.22% | 21.65% |
| 🇹🇹 Trinidad and Tobago | 3.93% | 11.52% | 32.67% |
| 🇹🇳 Tunisia | 4.4% | 9.02% | 31.24% |
| 🇹🇷 Turkey | 3.77% | 8.64% | 33.9% |
| 🇹🇲 Turkmenistan | 5.84% | 5.15% | 21.55% |
| 🇹🇨 Turks and Caicos Islands | 5.79% | 10.34% | 28.25% |
| 🇹🇻 Tuvalu | 4.98% | 6.48% | 16.15% |
| 🇺🇬 Uganda | 2.87% | 1.69% | 14.33% |
| 🇺🇦 Ukraine | 7.54% | 18.81% | 33.2% |
| 🇦🇪 United Arab Emirates | 3.35% | 1.83% | 15.77% |
| 🇬🇧 United Kingdom | 10.84% | 19.17% | 32.56% |
| 🇺🇸 United States | 8.18% | 17.13% | 30.47% |
| 🇻🇮 United States Virgin Islands | 7.54% | 20.42% | 39.11% |
| 🇺🇾 Uruguay | 8.23% | 15.58% | 35.98% |
| 🇺🇿 Uzbekistan | 5.87% | 5.14% | 22.24% |
| 🇻🇺 Vanuatu | 5.65% | 3.74% | 16.29% |
| 🇻🇪 Venezuela | 2.29% | 8.61% | 27.71% |
| 🇻🇳 Vietnam | 4.13% | 9.12% | 30.02% |
| 🇼🇫 Wallis and Futuna | 1.76% | 13.47% | 32.98% |
| 🇪🇭 Western Sahara | 2.82% | 5.84% | 23.73% |
| 🇾🇪 Yemen | 3.98% | 2.66% | 18.25% |
| 🇿🇲 Zambia | 2.76% | 1.75% | 12.66% |
| 🇿🇼 Zimbabwe | 3.18% | 3.32% | 14.22% |
| 🌐 World | 5.13% | 9.82% | 24.03% |
Some of the places with high elderly shares today include high-income countries like Japan (30%), Italy (24%), and Finland (23%).
The lowest shares are concentrated in the Middle East and Africa. Many countries have just 2% of their population aged 65 years and older, such as Qatar, Uganda, and Afghanistan.
But over time, almost all countries are expected to see their older population segments grow. In just three decades, it is estimated that one-in-four European, North American, and Asian residents will be over 65 years of age.
By 2100, a variety of Asian countries and island nations facing low population growth are expected to see more than one-third of their populations aged 65 years or older, including South Korea and Jamaica at 44%. However, it’s actually Albania that’s the biggest outlier overall, with a projected 49% of its population to be aged 65 and older by 2100.
Passing the Generational Torch
The challenge of an aging population is set to impact all sectors of society, including labor and financial markets, demand for housing and transportation, and especially family structures and intergenerational ties.
One way to help grasp the nature of transition is to note the changing ratio between seniors and young children in the world population, as seen in the below crossover diagram:
Dropping fertility rates, in addition to improved child and infant mortality rates, are known to have played a major role in the plateauing population of children.
However, not all countries have witnessed this crossover yet, as it usually coincides with higher levels of economic development.
As countries such as India, Brazil, and South Africa reach higher levels of per capita income, they will be likely to follow down the paths of more advanced economies, eventually experiencing similar demographic fates and challenges.
Loading…